
Usage:
interfaces
atom-spec
[ probeRadius rad ]
[ areaCutoff interface-area ]
[ interfaceResidueAreaCutoff res-area ]
Usage:
interfaces select
atom-spec1
contacting
atom-spec2
[ bothSides true | false ]
[ probeRadius rad ]
[ areaCutoff interface-area ]
[ interfaceResidueAreaCutoff res-area ]
The interfaces command calculates the buried
solvent-accessible surface
area (SASA) for each pair of chains in the
specified set of atoms, based on chain IDs,
and generates a network diagram
of the interchain interfaces.
 Unspecified atoms are ignored, but
solvent, ions, and ligand residues are NOT excluded automatically.
The buried SASA is calculated as described for
measure buriedarea,
and results are reported in the Log.
Unspecified atoms are ignored, but
solvent, ions, and ligand residues are NOT excluded automatically.
The buried SASA is calculated as described for
measure buriedarea,
and results are reported in the Log.
See also:
Select Contacts,
clashes/contacts,
crystalcontacts,
measure buriedarea,
crosslinks,
hbonds,
VDW radii,
measurements,
the ChimeraX interfaces highlight
The default probeRadius rad for calculating each SAS
is 1.4 Å, often used to approximate a water molecule.
Interfaces with at least interface-area buried
(default 300 Å2, can be changed with the
areaCutoff option) are counted as interfaces
and shown as lines in the diagram.
Residues with at least res-area buried
(default 15 Å2, can be changed with the
interfaceResidueAreaCutoff option) are considered to be
interface residues.
The interfaces select command selects
interface residues based on the buried area between chains in
atom-spec1 and
atom-spec2.
Only chain-chain contacts that bury at least
the areaCutoff value are counted as interfaces, and only
residues with at least the interfaceResidueAreaCutoff value
buried are considered to be interface residues (same defaults as above).
The bothSides option indicates whether to select interface residues
from both atom-spec1 and
atom-spec2 (if true) or from
atom-spec1 only (if false, default).
For a similar calculation but without grouping residues by chain, see
measure buriedarea.
[back to top: interfaces]
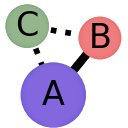
Chain-Chain Network Diagram
In the 2D network diagram
created by the interfaces command,
the nodes (circles) represent chains,
and the edges (lines) between nodes
represent chain-chain interfaces.
Node colors match the predominant colors of the chains when the
diagram is created, but will toggle between that initial color when
a chain is shown and gray when it is hidden.
Node sizes are proportional to chain surface areas.
Smaller interfaces (buried SASA less than half that of the largest interface
in the structure) are indicated with dotted lines.
Ctrl-clicking a node selects
the atoms of the corresponding chain,
Ctrl-clicking an edge selects
the atoms of the two connected nodes, and Ctrl-clicking the background
of the diagram clears any selection.
The diagram can be moved with middle- or right-mouse drag
and expanded/contracted with scrolling
(see ChimeraX trackpad equivalents).
Expansion/contraction is about the point initially clicked
and does not affect node sizes, only their spacing.
The panel containing the diagram can be
manipulated
like other ChimeraX panels.
Left-clicking the diagram
raises a context menu. (This differs from other tools, in which
right- or Ctrl-click is used.)
Most context menu entries act on only the atoms used in the
buried-area calculations, as specified in the
interfaces command; any other atoms are ignored.
Showing/hiding chains with the context menus does not affect
surface displays.
The background context menu includes:
- Show All
– display all chains used in the calculation
- Select All Contact Residues
– select
only the interface residues from all chains
- Select All
– select all atoms used in the calculation
- Clear Selection
– clear the current selection
- Explode All
– move chains apart to separate the interfaces; exploding an interface
moves two chains in opposite directions along the line connecting the
geometric centers of the two sets of
interface residues
- Unexplode All
– move chains back together to restore the original structure
- Lay Out to Match Structure
– redraw diagram with orientation similar to the current 3D structure
(including repulsion to prevent node overlaps in the diagram)
- Orient Structure to Match Layout
– rotate the structure to an orientation similar to the 2D diagram
- Save Plot As...
save the plot window contents as PNG, PDF, or SVG,
using parameters of the matplotlib
Figure.save_fig() method:
resolution 300 dpi (if PNG or PDF) and border padding 0.1 inch. Currently,
there is no command for saving the plot and no way to change these parameters.
The node context menu includes:
- Show Only [chain]
– show the corresponding chain; hide others
- Show [chain] and Neighbors
– show only the corresponding chain and its contacting chains
- Show Contact Residues of Neighbors with [chain]
– show the corresponding chain with its
interface residues
in light gray, plus only the relevant
interface residues
from its contacting chains
(not their interface residues
with other chains)
- Select [chain]
– select the corresponding chain
(same as Alt-clicking the node)
- Select Neighbors of [chain]
– select
chains contacting the corresponding chain
- Select Contact Residues of [chain] and Neighbors
– select the
interface residues
on both sides of all interfaces
of the corresponding chain
- Explode Neighbors of [chain]
– move chains apart to separate the interfaces
- Unexplode Neighbors of [chain]
– move chains back together
- Save Plot As...
as above
The edge context menu includes:
- Show Only [chain1] and [chain2]
– show the corresponding chains; hide others
- Show Contact Residues of [chain1] with [chain2]
– show only the
chain1-chain2 interface residues
of chain1, plus all of chain2 as spheres
with its non-interface residues in light gray; orient view to face chain2
- Show Contact Residues of [chain2] with [chain1]
– show only the
chain1-chain2 interface residues
of chain2, plus all of chain1 as spheres
with its non-interface residues in light gray; orient view to face chain1
- Residue Plot [chain1] with [chain2]
– adjust the 3D view in the same way as
Show Contact Residues of [chain1] with [chain2] (above)
and create an interface residue plot, essentially
a 2D representation of the 3D view: colored circles for individual
chain1-chain2 interface residues
superimposed on a gray silhouette of the remaining residues of chain2
- Residue Plot [chain2] with [chain1]
– adjust the 3D view in the same way as
Show Contact Residues of [chain2] with [chain1] (above)
and create an interface residue plot, essentially
a 2D representation of the 3D view: colored circles for individual
chain1-chain2 interface residues
superimposed on a gray silhouette of the remaining residues of chain1
- Select [chain1] and [chain2]
– select the corresponding chains
(same as Alt-clicking the edge)
- Select Contact Residues of [chain1] and [chain2]
– select the
chain1-chain2 interface residues
of both chains
- Select Contact Residues of [chain1] with [chain2]
– select the
chain1-chain2 interface residues
of chain1
- Select Contact Residues of [chain2] with [chain1]
– select the
chain1-chain2 interface residues
of chain2
- Explode [chain1] and [chain2]
– move chains apart to separate the interfaces
- Unexplode [chain1] and [chain2]
– move chains back together
- Save Plot As...
as above
[back to top: interfaces]
Interface Residue Plot
A plot of the chain-chain interface residues
can be shown using the edge context menu
in a chain-chain network diagram.
The residue plot is a 2D representation of what would be
obtained in 3D with Show interface (below):
colored nodes (circles) for individual chain1-chain2
interface residues superimposed on
a gray silhouette of the remaining residues of the second chain.
The interface-residue nodes are colored to match the structure and
labeled by residue number.
Ctrl-clicking a node selects the corresponding
residue in the structure
and Ctrl-clicking the background of the diagram clears any selection.
The diagram can be moved with middle- or right-mouse drag
and expanded/contracted with scrolling
(see ChimeraX trackpad equivalents).
The residue plot has its own context menus, with:
- Show Interface
– in 3D, show the interface residues
from the two chains plus the remaining residues of the second chain in
light gray; orient view to face the second chain, shown as spheres
- Select Residue (in residue context menu)
– select
the corresponding residue in the structure
- Save Plot As...
as above
UCSF Resource for Biocomputing, Visualization, and Informatics /
May 2022

