
The IGTC was originally established as a subgroup of the International Mouse Mutagenesis Consortium to 1) create an international resource of embryonic stem cells with gene trap insertions, 2) disseminate this information through a common web site and 3) facilitate incorporation of gene trap information into the primary web browsers. In April 2005, Drs. Babbitt and Ferrin organized an IGTC informatics workshop in San Francisco to initiate additional interactions among informatics scientists from IGTC organizations and make plans for a new IGTC database and web site to provide enhanced access to the scientific community. Participants included six gene-trapping centers from the United States, Canada, the United Kingdom, Germany, and Japan. In addition, representatives from Mouse Genome Informatics (MGI), National Center for Biotechnology Information (NCBI), and the Univ. of California at Santa Cruz (UCSC) and Ensembl genome browsers attended and agreed to collaborate with us, providing useful advice regarding integration of IGTC data into their resources. A plan for a new IGTC database and Web site was unanimously adopted by the participants. Using the SIGTR, BayGenomics, and initial IGTC informatics efforts created at the Sanger Center (www.igtc.org.uk) and in Canada (www.igtc.ca) as starting points, we implemented a new database and web site, which was released publicly in August 2005 (Nord, 2006). The IGTC site now includes approximately 385,000 characterized ES cell lines representing nearly 40% of known mouse genes as measured against the Ensembl build 54 gene set.
Two primary goals of the new IGTC informatics effort are to generate a standardized informatics pipeline for data management and annotation of gene trap cells lines and to provide in one place easy access and sophisticated tools for analysis of resource data. To ensure a common format and public availability of gene trap sequences, IGTC data is provided by the individual experimental centers to the NCBI dbGSS database (www.ncbi.nlm.nih.gov/dbGSS/). Using automated scripts, we download the data daily into the IGTC MySQL database and apply the IGTC annotation pipeline, which then automatically populates our database with the annotation information presented on the IGTC web site. For the IGTC, gene trap mutations are characterized by sequencing, followed by in silico identification and annotation of the gene that has been trapped. Using automated scripts, information is obtained from the genome browsers and many other informatics sites to annotate the knockout loci. Because the IGTC identification and annotation pipelines are entirely automated and run continuously, we can maintain up-to-date information about each gene in the database, taking advantage of new names, symbols, and sequences as they appear in the public databases.
IGTC Gene Identification Protocol
The identification protocol we developed for the IGTC improves upon that
used at BayGenomics and at Sanger in that it uses both genomic localization and transcript-based
identification as independent approaches to confirm the identification of a
gene knockout. Figure 2 shows the identification and annotation pipeline,
which was designed to be both robust and flexible. Although localization using
BLAT (http://genome.ucsc.edu/cgi-bin/hgBlat?command=start) and transcript
identification using AutoIdent are the only annotation protocols shown in
Figure 2, the pipeline was designed so that other methods in addition to or in
place of these can easily be incorporated.
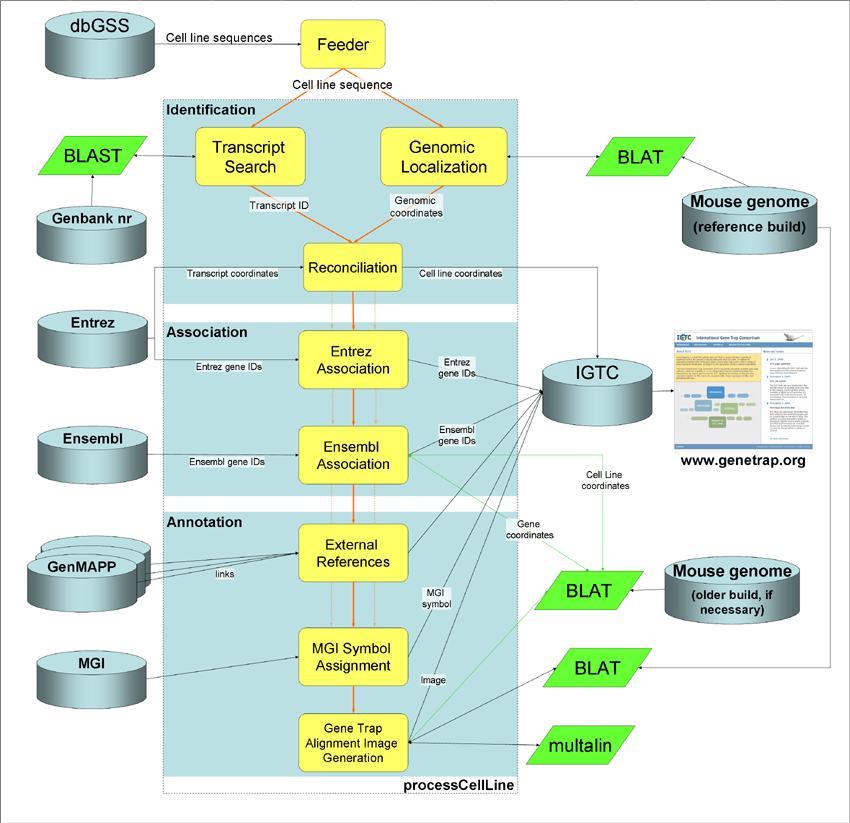
Figure 2: The IGTC annotation pipeline
Currently, the pipeline compares results from the two identification protocols using overlap between the direct genomic localization of a cell line and the genomic localization of its associated transcripts to reconcile and confirm the identification, whenever possible. The major genome browsers do not always agree on the exact location of a mouse knockout or even the gene associated with it. For example, in a recent study our group performed to compare the performance of genome localization algorithms, only about 7,000 of our test set of 30,000 IGTC sequence tags could be associated with approximately 3,000 genes assigned exactly the same coordinates at all three of the genome browsers (Harper, 2006).
For the IGTC resource, genomic coordinates are used as the primary identification data and these map coordinates are then used to query the Ensembl and NCBI databases and MGI to obtain features and other annotation information for the identified locus. Results from cell line localization are updated with each Ensembl build and AutoIdent regularly BLASTs all the sequences in the database against the GenBank NR database to update accession numbers and related information. All information in the database is available for download in a tab-delimited format.
IGTC Web Site (http://www.genetrap.org/)
The database was structured to optimize information access via web queries and the IGTC web site was designed to provide user friendly access to all of the data in a variety of ways. The gene annotation page provides a gene-centric view of IGTC data. For each gene for which a knockout cell line is available, the gene name and gene symbol are provided along with identifiers linking a user to information about that gene at GenBank, Entrez Gene, and MGI. Every IGTC cell line matching that gene is listed, linked to its cell line annotation page. Alignment images are provided on gene annotation pages to provide user-friendly graphical representations of cell lines available for each gene. As shown in Figure 1, these images allow a user to quickly see how many knockout cell lines are available and where they fall relative to the reference gene (NM identifier at GenBank). Alignment to the coding strand, on which exons have been delineated, is also presented. These images are generated and updated automatically from the data in our database.
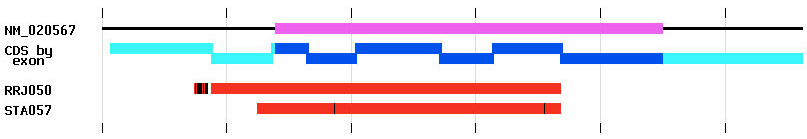
Figure 1: Image showing alignment of two BayGenomics cell line sequence tags RRJ050 and STA057 to the gene NM_020567. Ticks represent intervals of 200 bases. The coding region of this gene is shown on the top line in magenta with the horizontal black line denoting the length of the gene in the alignment. The coding strand (CDS) representation is shown in blue with the predicted exon boundaries delineated by the offsets. The cyan regions show genomic sequence outside of the CDS, such as 5' and 3' untranslated regions. The sequence tags are shown in red. The vertical black lines on the sequence tags denote mismatches in the alignment between the gene and the sequence tag sequences.
The cell line annotation pages present the identification status and process date. Additional information is provided when available, such as MGI symbol, gene description, chromosome position. A link is also provided back to the source record as dbGSS. The genomic localization of each cell line is provided both as Ensembl and UCSC browser IDs that link a user directly to the genome browsers with IGTC cell lines displayed as an annotation track. A cell line detailed report includes specific result details from each of the identification protocols applied. The web site also provides interfaces for BLAST searching, text-based search and browse capabilities, and to allow viewing of trapped genes in the context of biological pathways.
The RBVI Resource Center has absolutely been instrumental in developing the informatics technology used by the IGTC project. Drs. Babbitt and Ferrin, and the rest of the RBVI team, have spearheaded the IGTC and created a first-class international resource for use by gene trap researchers worldwide.
References:
- D. Stryke, M. Kawamoto, C.C. Huang, S.J. Johns, L.A. King, C.A. Harper, E.C. Meng, R.E. Lee, L. L'Italien, P.T. Chuang, S.G. Young, W.C. Skarnes, P.C. Babbitt, and T.E. Ferrin, "BayGenomics: A Resource for Gene- Trapped Mouse Embryonic Stem Cells," Nucleic Acids Res., 31(1):278-281, 2003.
- A.S. Nord, P.J. Chang, B.R. Conklin, T. Cox, C.A. Harper, G. Hicks, C.C. Huang, M. Kawamoto, S. Liu, E.C. Meng, J.H. Morris, W.C. Skarnes, P. Soriano, W.L. Stanford, D. Stryke, W. Wurst, K.I. Yamamura, S.G. Young, P.C. Babbitt, and T.E. Ferrin, "The International Gene Trap Consortium Website: a Collaborative Functional Genomics Resource Representing All Publicly Available Gene Trap Cell Lines in Mouse," Nucleic Acids Res., 34(database issue):D642-D648, 2006.
- C.A. Harper, C.C. Huang, D. Stryke, M. Kawamoto, T.E. Ferrin, and P.C. Babbitt, "Comparison of Methods for Genomic Localization of Gene Tag Sequences," BMC Genomics, 7:236, 2006.