electron microscopy
Tom Goddard
August 6, 2021
Here are examples comparing protein structures predicted by the machine learning AlphaFold algorithm to experimental structures from electron microscopy and X-ray crystallography. Experimental structures are from the Protein Data Bank and the predicted structures are from the AlphaFold database which has about 365,000 structures from the proteomes of 21 organisms. The comparison is done in ChimeraX software using the alphafold match command.
Missing segements modeled. AlphaFold predictions include loops and N and C termini that are often not resolved in experimental structures. These are usually disordered but provide a starting point for understanding their function.
Identify experimental structure mistakes. Segments of AlphaFold predictions that differ from experimental structures and are assigned high confidence indicate regions of experimental structures to double check.
Limited coverage. The AlphaFold database includes predictions for all sequences in the UniProt reference proteomes for 21 organisms (Human, Mouse, Rat, Fruit fly, Zebrafish, Arabidopsis, Nematode worm, Soybean, Asian rice, Maize, Budding yeast, Fission yeast, E. coli, C. albicans, Dictyostelium, L. infantum, M. jannaschii, M. tuberculosis, P. falciparum, S. aureus, T. cruzi), about 365,000 predicted protein structures.
Assemblies not predicted. The AlphaFold algorithm does not predict structures of multi-protein complexes, only single proteins. Ligands and ions are not predicted.
Look at all recent structures (newer than May 2021) released after AlphaFold database structures were predicted so AlphaFold did not use these structures in making predictions. We look at several examples including single proteins, assembling single protein predictions into complexes, using exact sequence and homolog predictions.
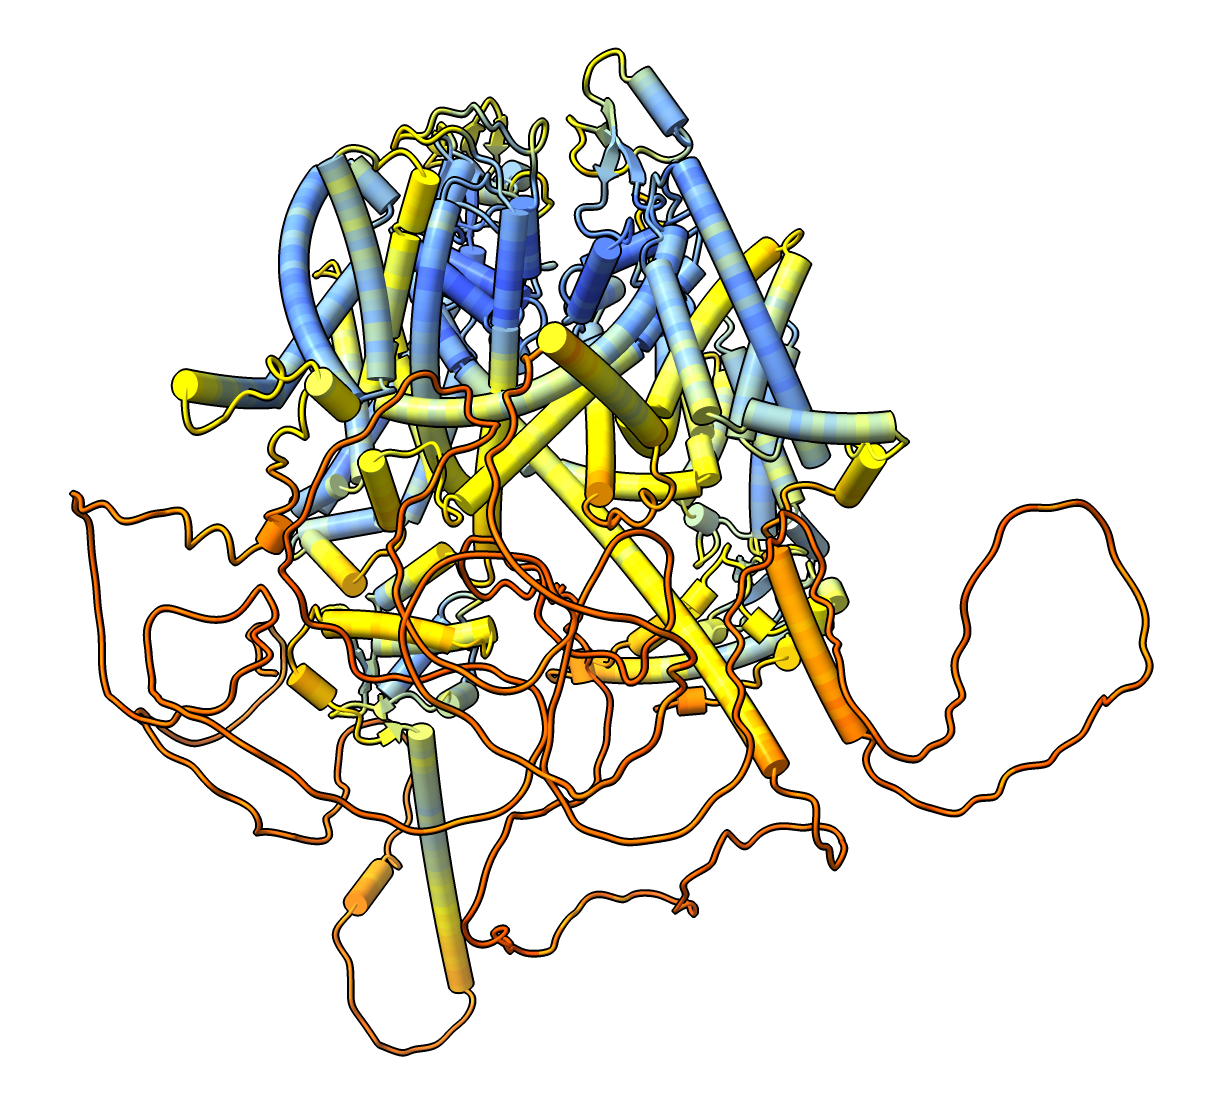
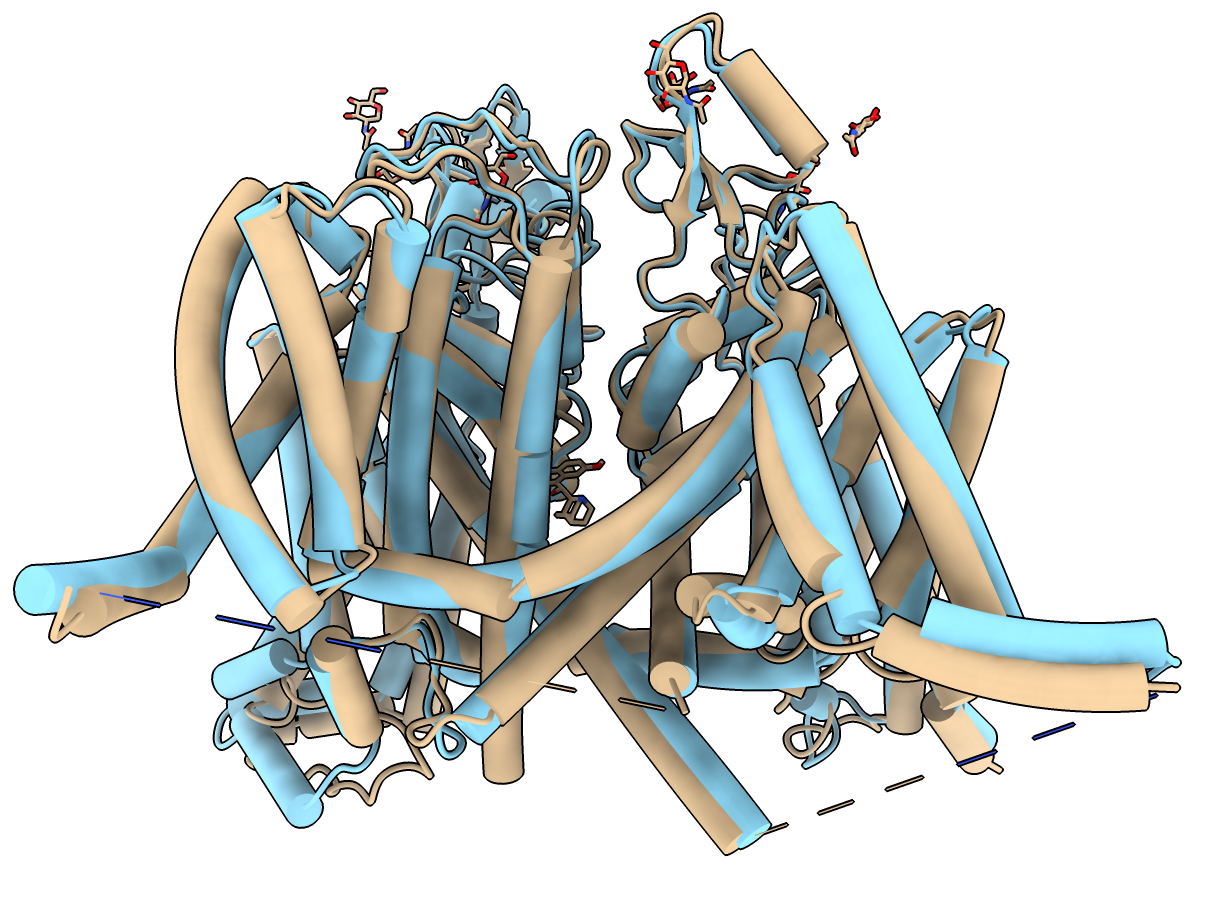
This human voltage-gated sodium channel is a single protein with 4-fold symmetry, PDB 6LQA, and has an AlphaFold predicted structure with the exact same sequence UniProt Q14524.
ChimeraX commands to fetch the PDB and AlphaFold models and show helices as cylinders
open 6lqa alphafold match #1 preset cylinder |
| ||||||||||||||||||
The command output indicates the AlphaFold model and experimental sample have 2016 residues but only 1151 are observed in the experimental structure with a 2 Angstrom C-alpha RMSD difference between predicted and experimental models. The AlphaFold model is superimposed and colored (blue to red) by the AlphaFold confidence score. The AlphaFold model has 4 large intracellular loops not seen in the experimental structure that can be hidden and the model given a single color using commands
  hide #2:1-118,430-698,943-1187,1782-2016 ribbon
  color #2 skyblue
|
electron microscopy |
|
|
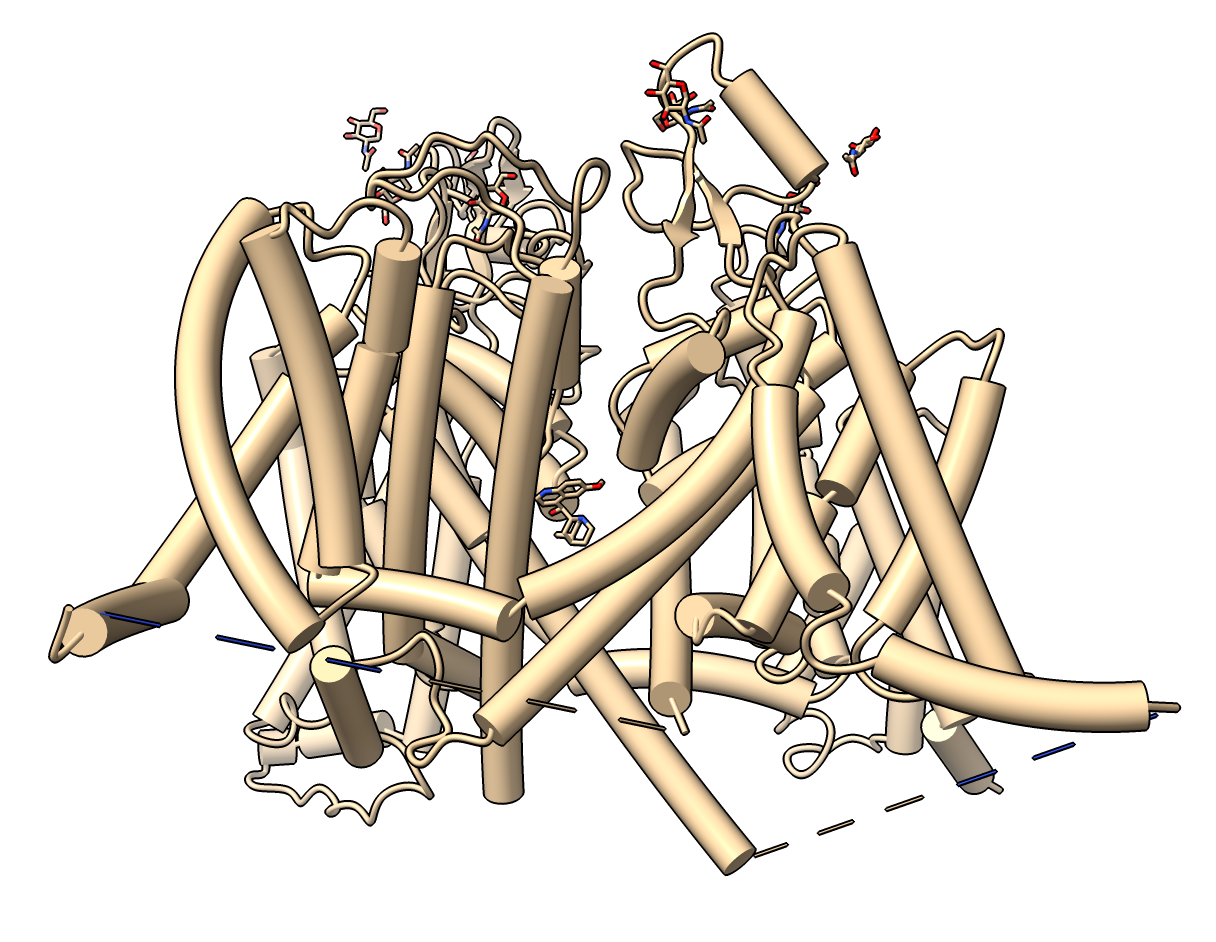
Salmonella sugar transporter 7L16 is not in the AlphaFold database but has an E. coli homolog P02921.
ChimeraX commands to fetch the PDB and AlphaFold models and show helices as cylinders
open 7l16 alphafold match #1 preset cylinder |
| |||||||||||||||||||||
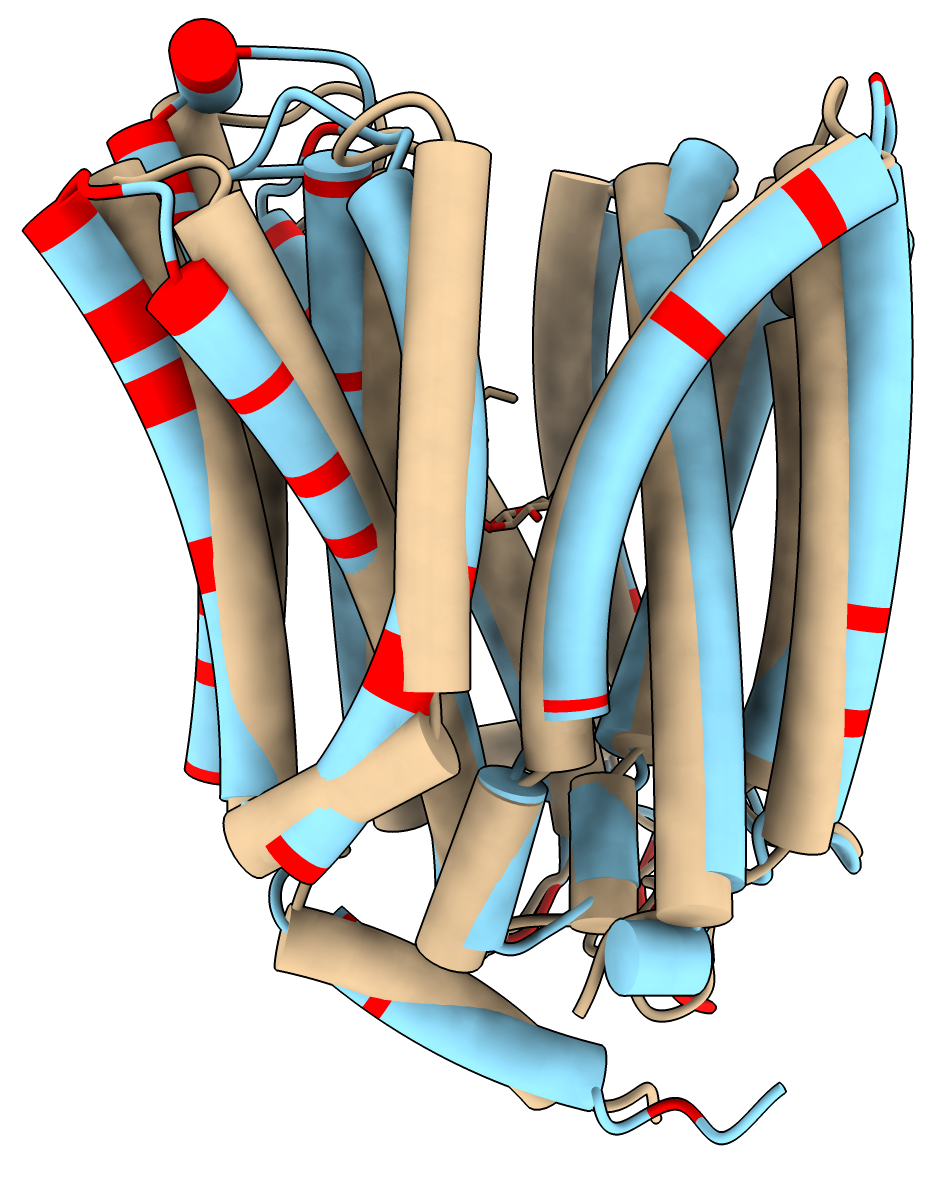
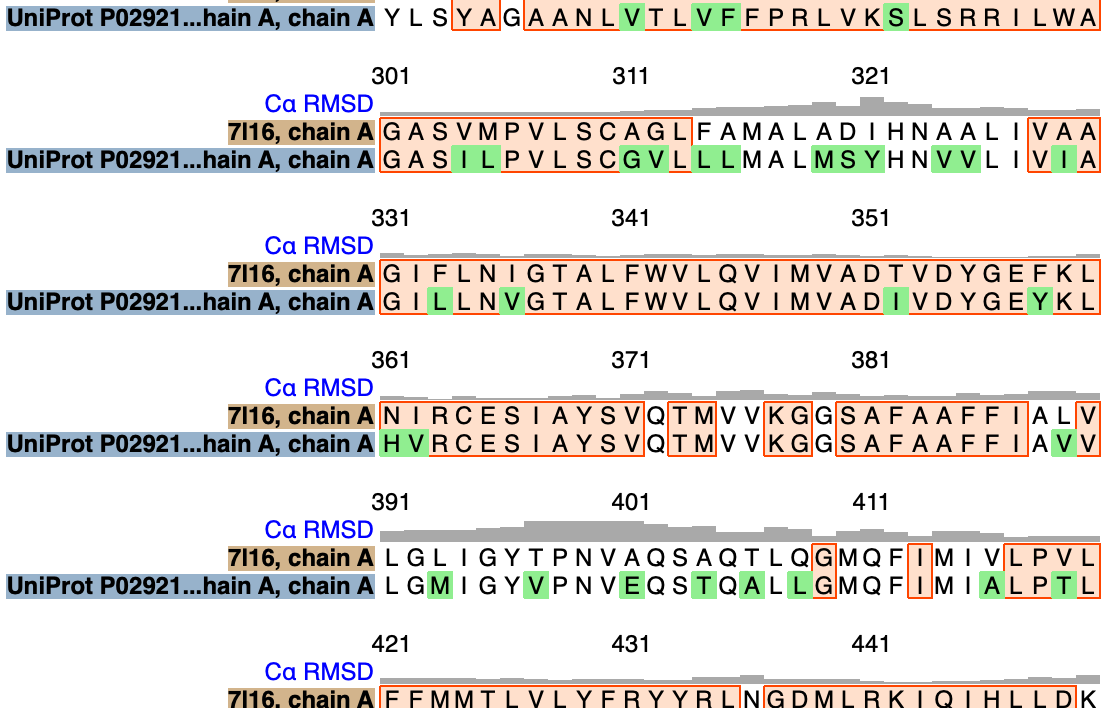
To show a sequence alignment and color sequence differences between the Salmonella experimental structure and E. coli predicted structure use commands
  matchmaker #2 to #1 showAlignment true
  color #2 skyblue
  color #2::seq_conservation<=0 red
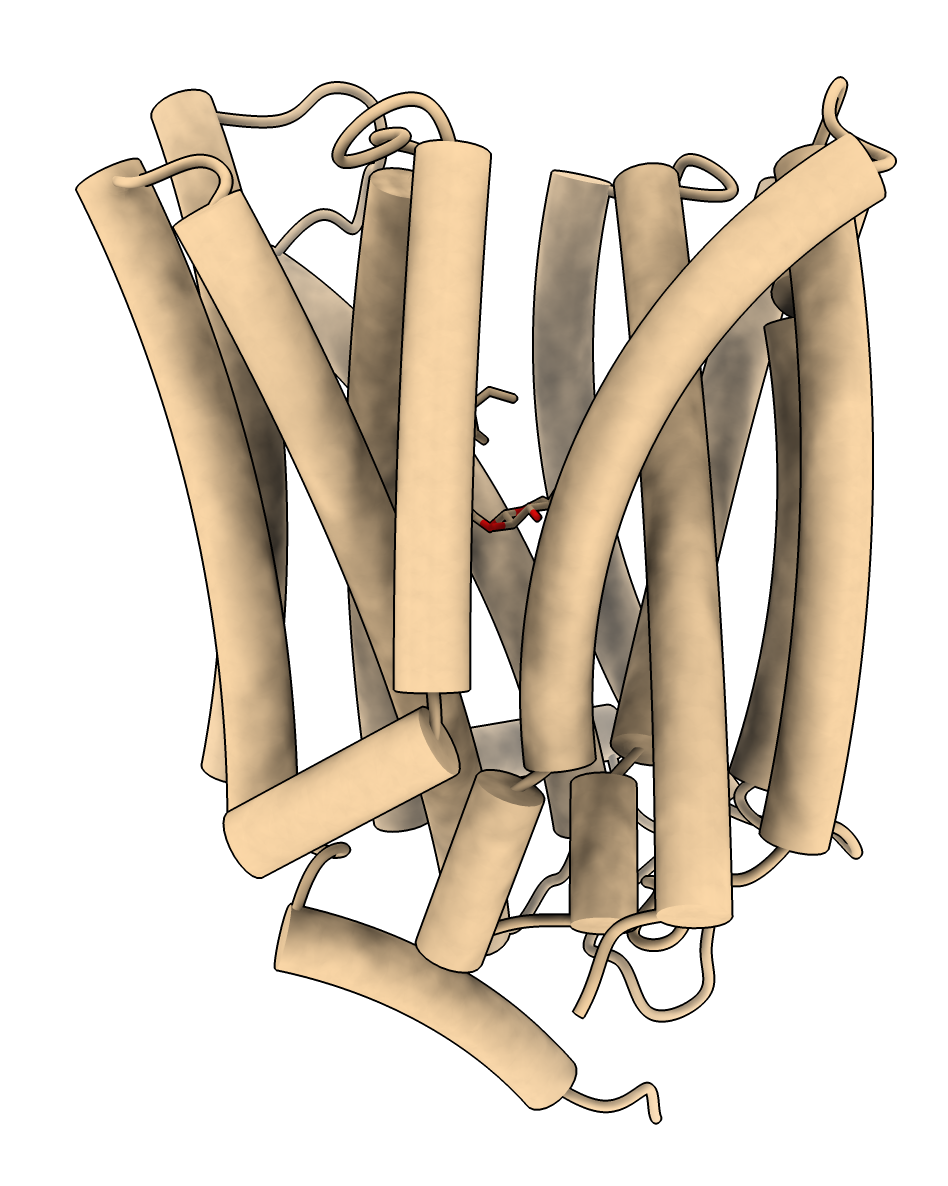
Structure 7L16 from X-ray crystallography | 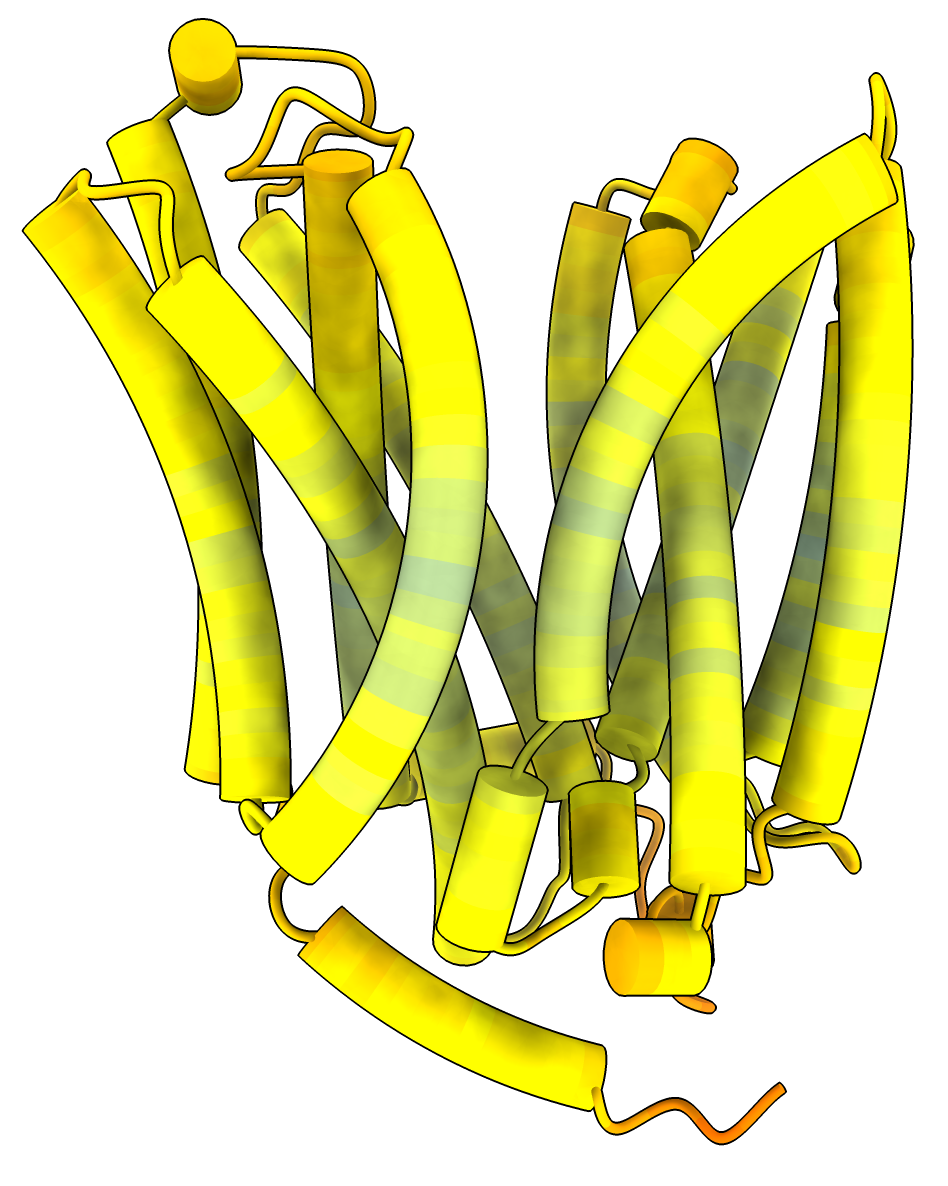
| 
| 
select #2::seq_conservation<=0 |
|
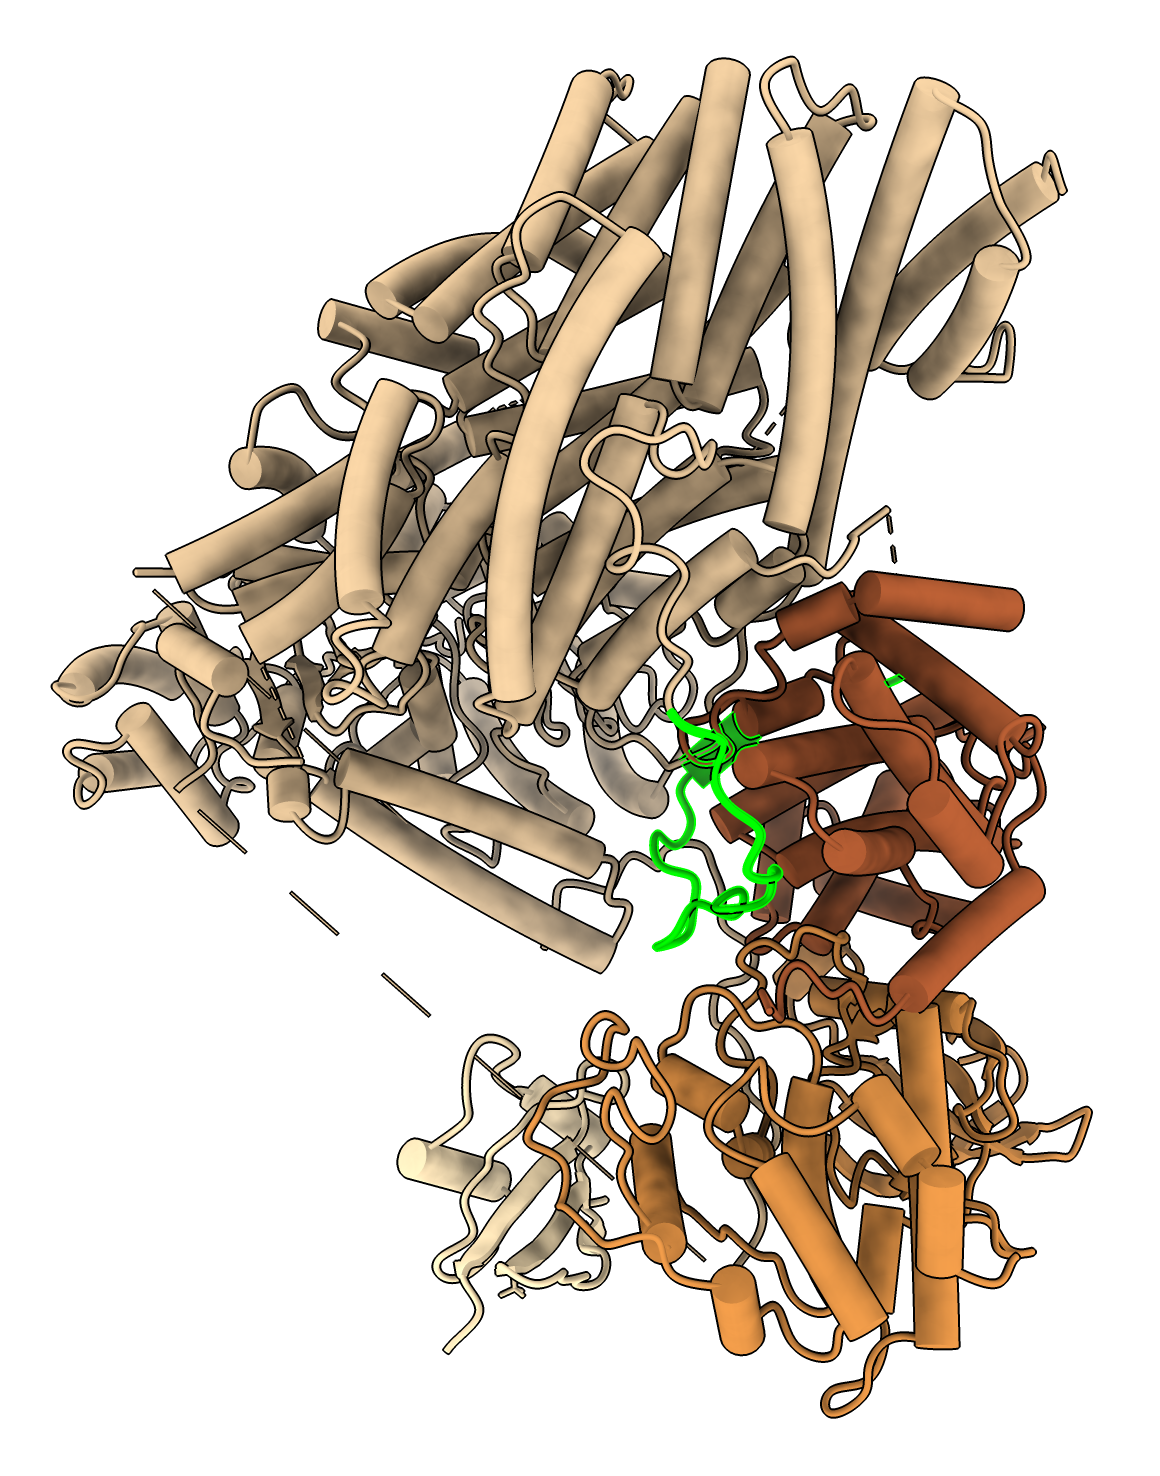
Four protein complex composed of separase-securin fusion, CDK1, cyclin B1, CKS1, PDB entry 7NJ0. Separase releases chromosome pairs during mitosis and is inhibited by cylcin proteins. AlphaFold predictions of these four proteins in isolation mostly agree with electron microscopy except at interfaces. ChimeraX commands to fetch the PDB and AlphaFold models and show helices as cylindersopen 7nj0 alphafold match #1 preset cylinder |
| ||||||||||||||||||||||||||||||||||||||||||
|
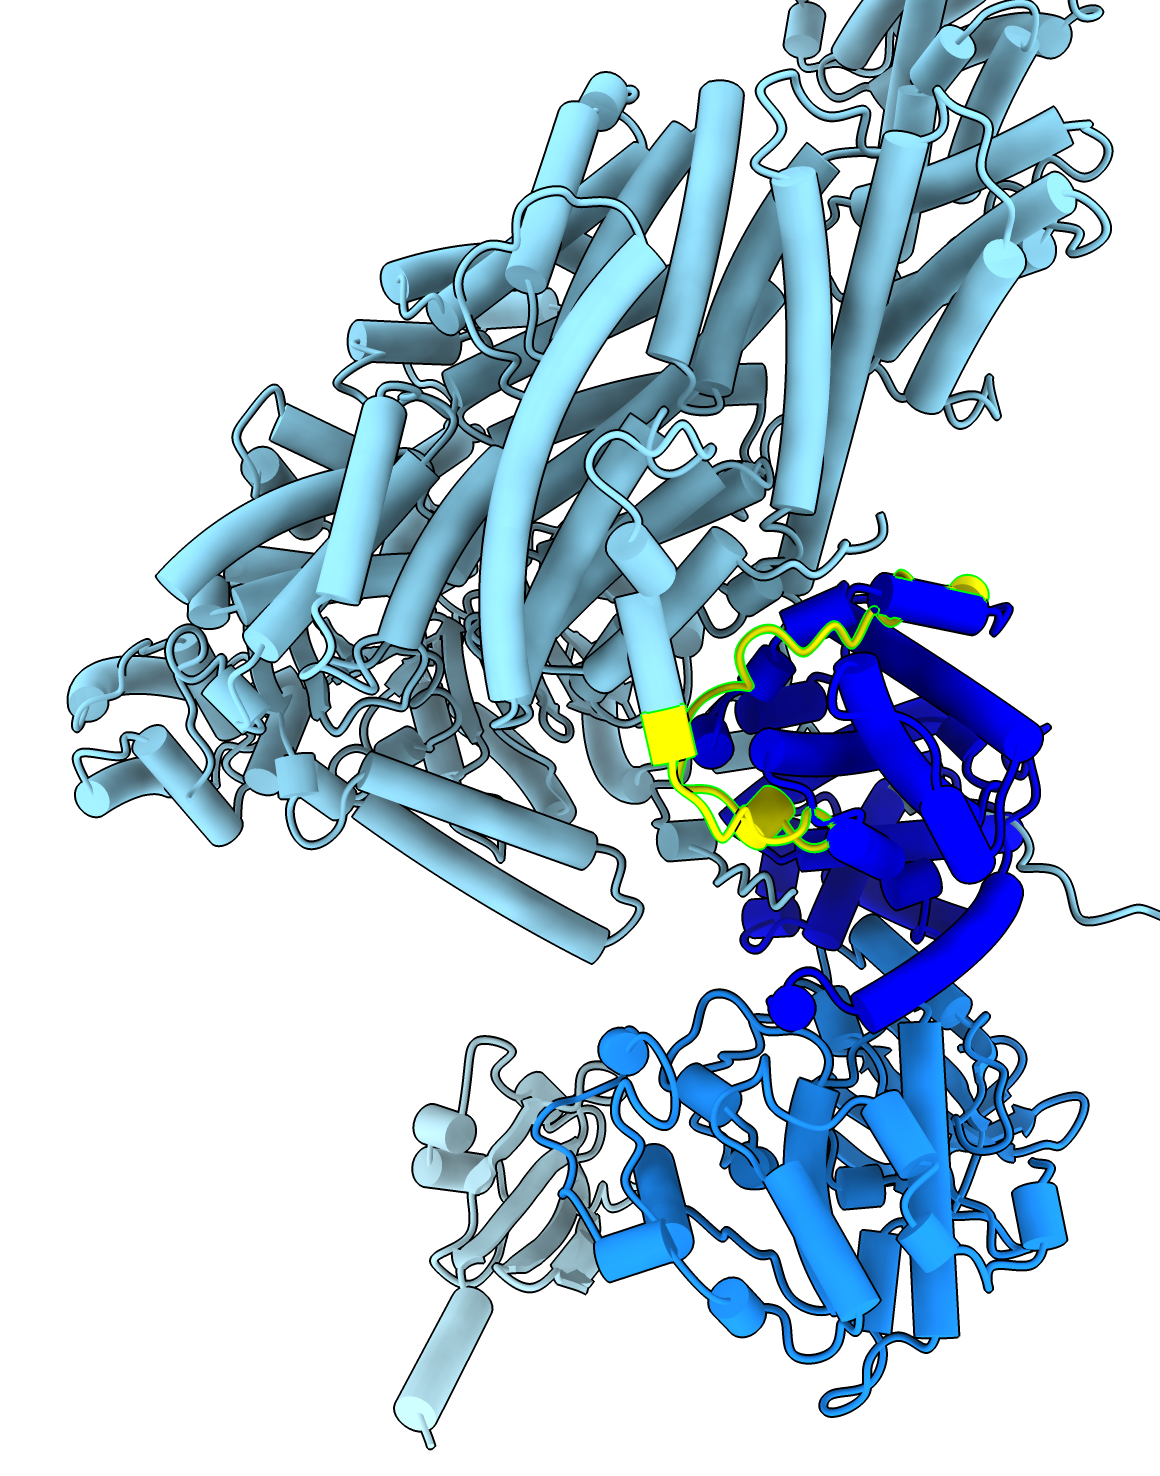
To color the four chains and hide the large disordered loops in the AlphaFold model that are not resolved in the experimental structure use commands color #1/B red color #1/C sienna color #1/D wheat color #2/A skyblue color #2/B dodgerblue color #2/C blue color #2/D lightblue hide #2/A:1066-1097,1298-1571 ribbons hide #2/C:1-161 ribbons |
|
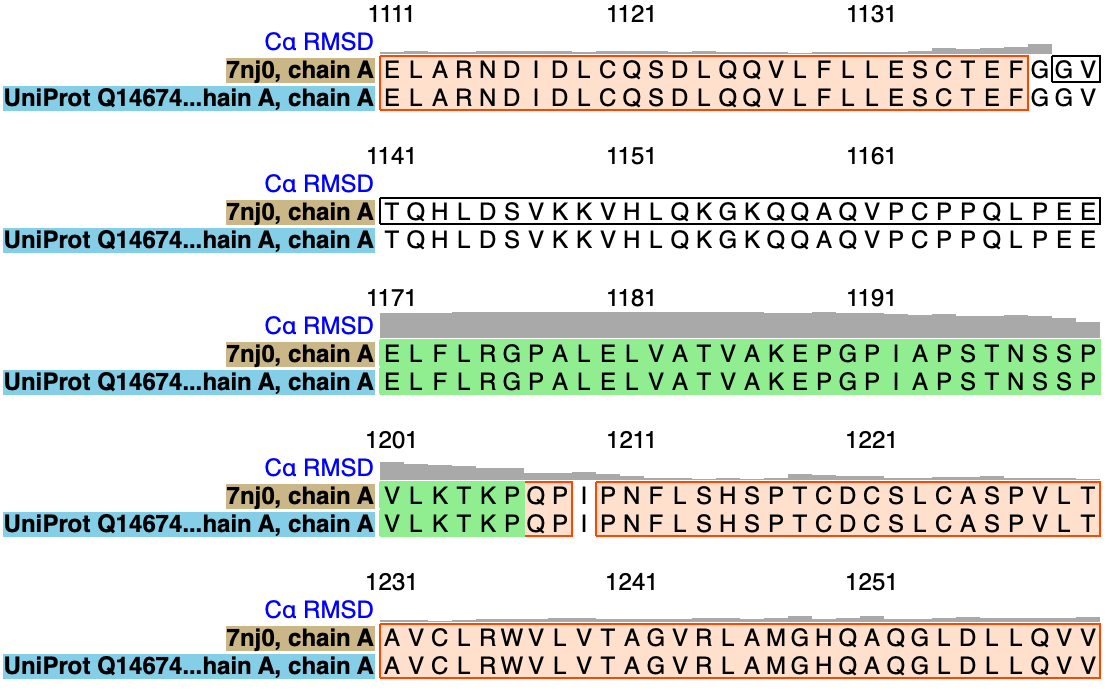
To see regions of where structures differ look at C-alpha RMSD per residue shown on sequence alignment created with command
match #2.2 to #1/A showAlignment true
| 
| 
|
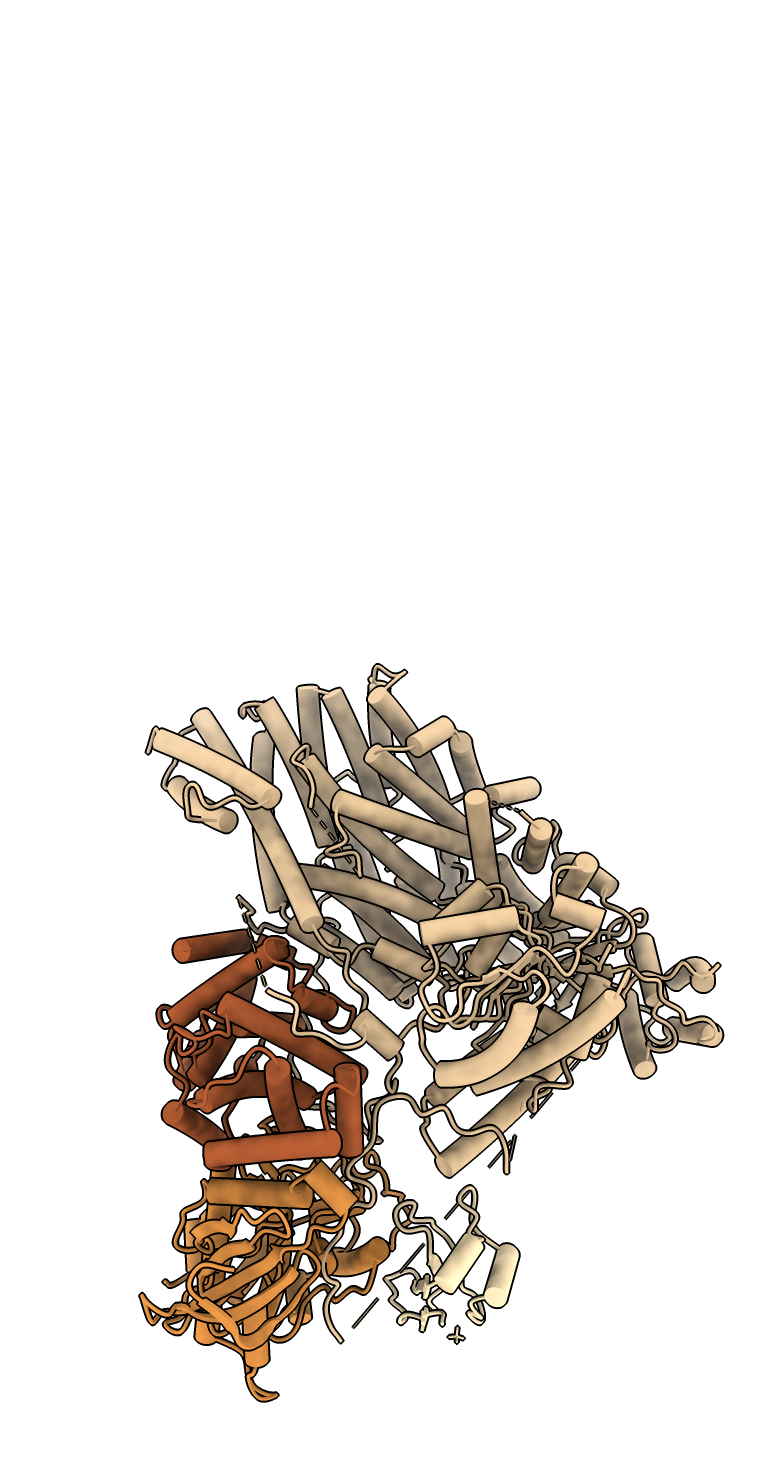
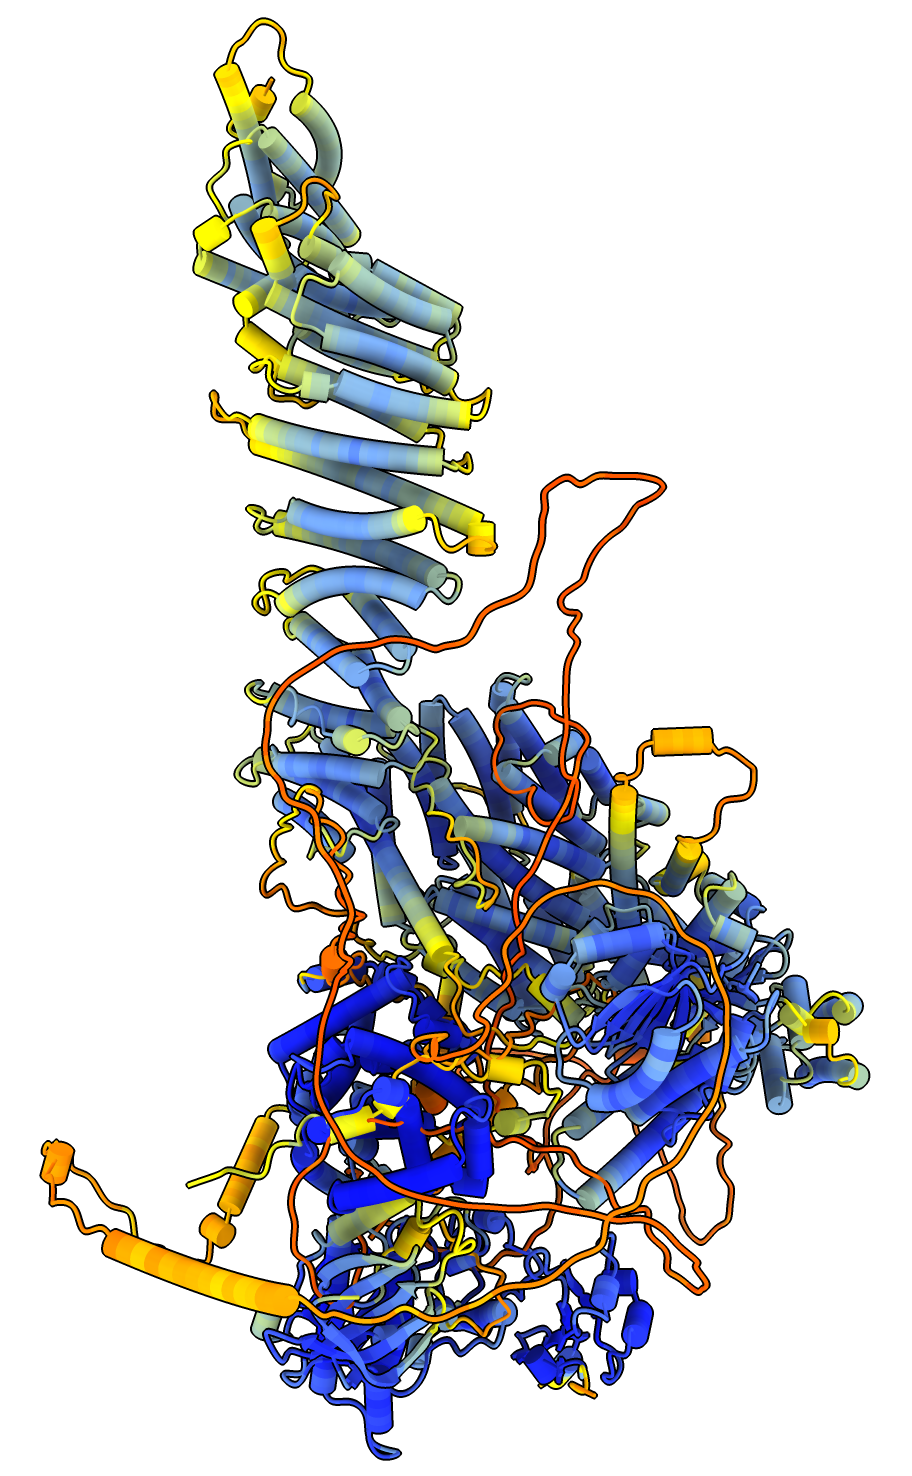
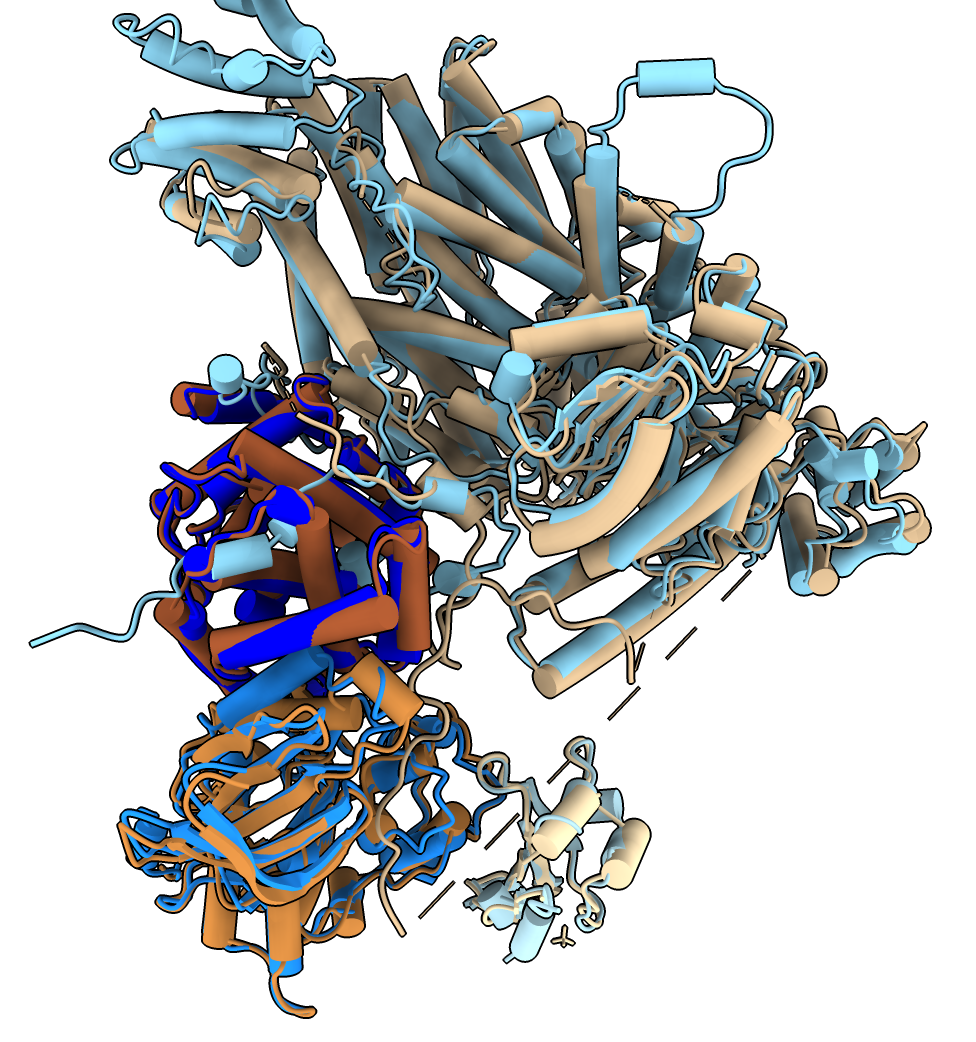
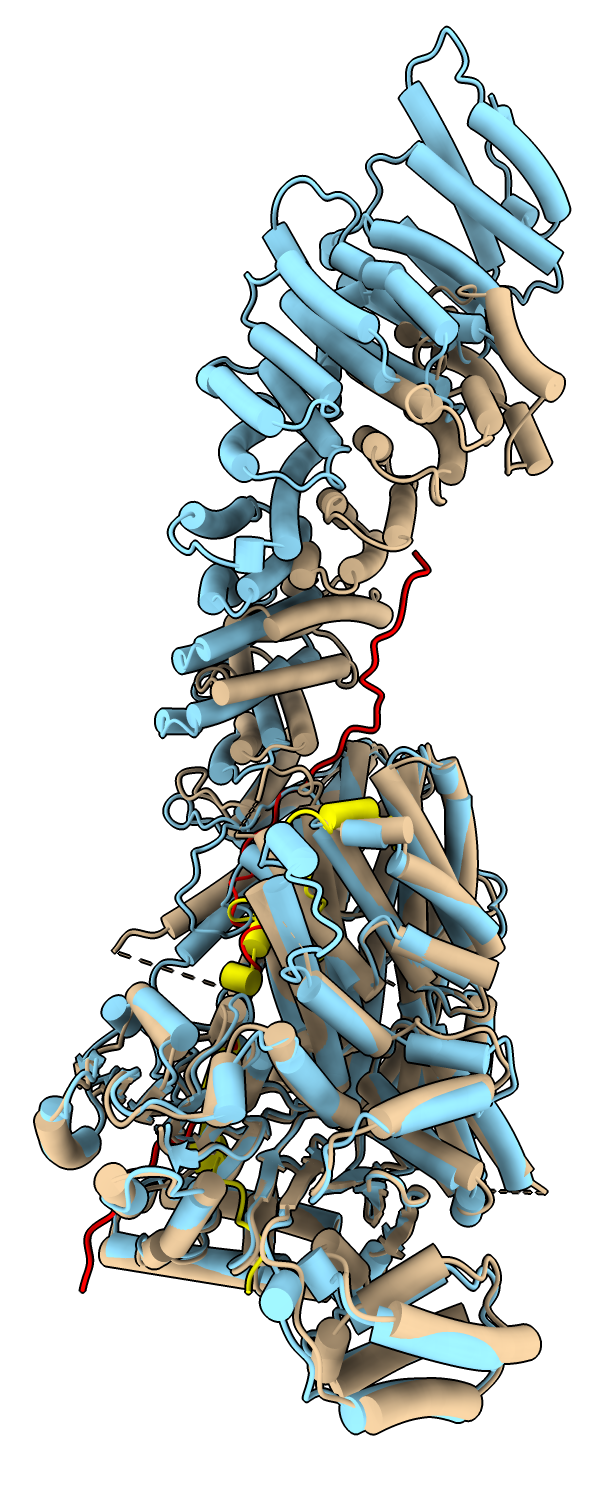
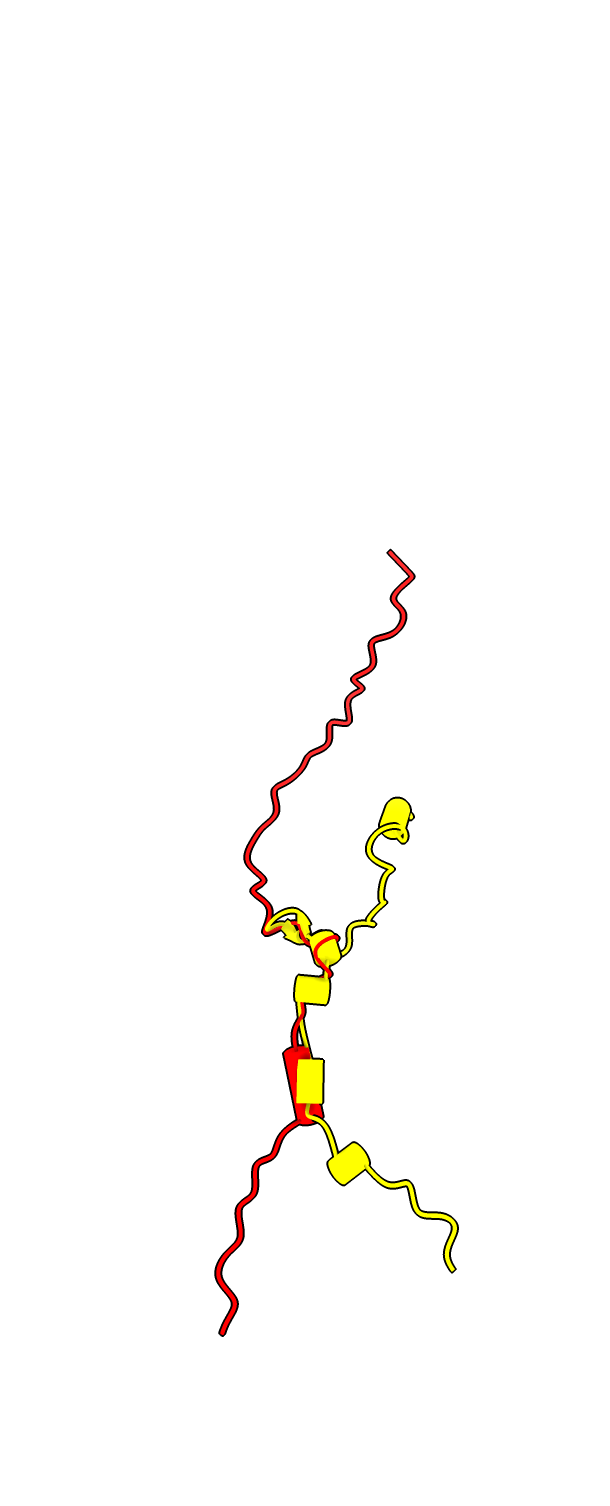
Two protein complex of separase and securin, PDB entry 7NJ1, where securin is intertwined with separase. Separase releases chromosome pairs during mitosis and is inhibited by securin. AlphaFold predictions of these two proteins in isolation do not get the right conformation since protein-protein interactions strongly effect the securin conformation.
ChimeraX commands to fetch the PDB and AlphaFold models and show helices as cylinders
open 7nj1 alphafold match #1 preset cylinder |
| ||||||||||||||||||||||||
To color the two chains and hide the large disordered loops in the AlphaFold model that are not resolved in the experimental structure use commands
  color #1/B red
  color #2.1 skyblue
  color #2.2 yellow
  hide #2.1:1065-1143,1279-1572 ribbons
  hide #2.2:1-110,164-202 ribbons
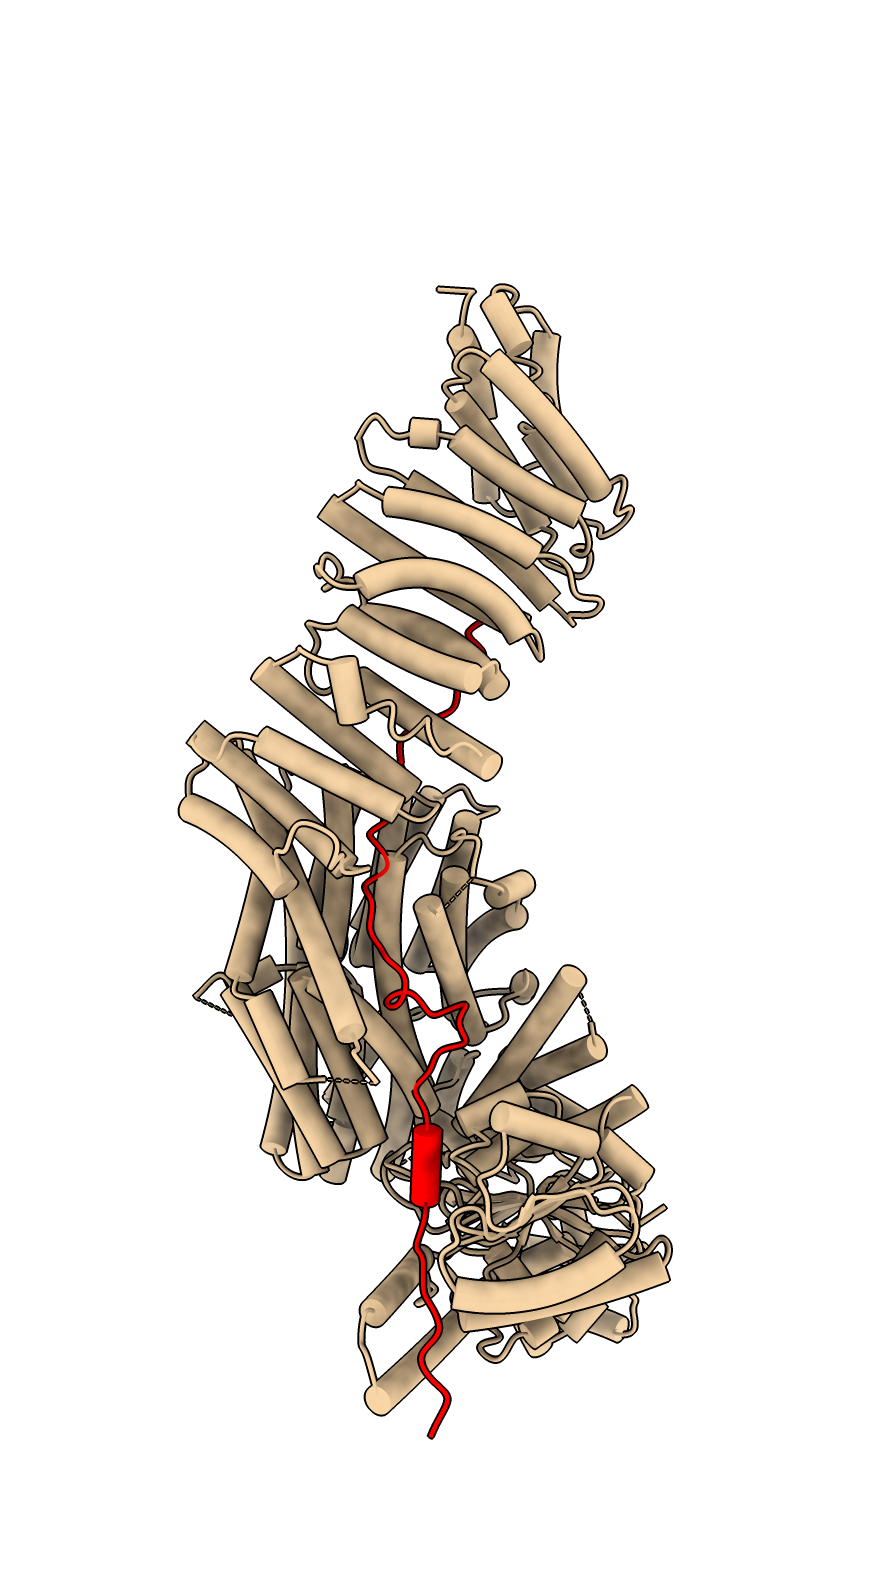
Structure 7NJ1 from electron microscopy, separase brown, securin red. | 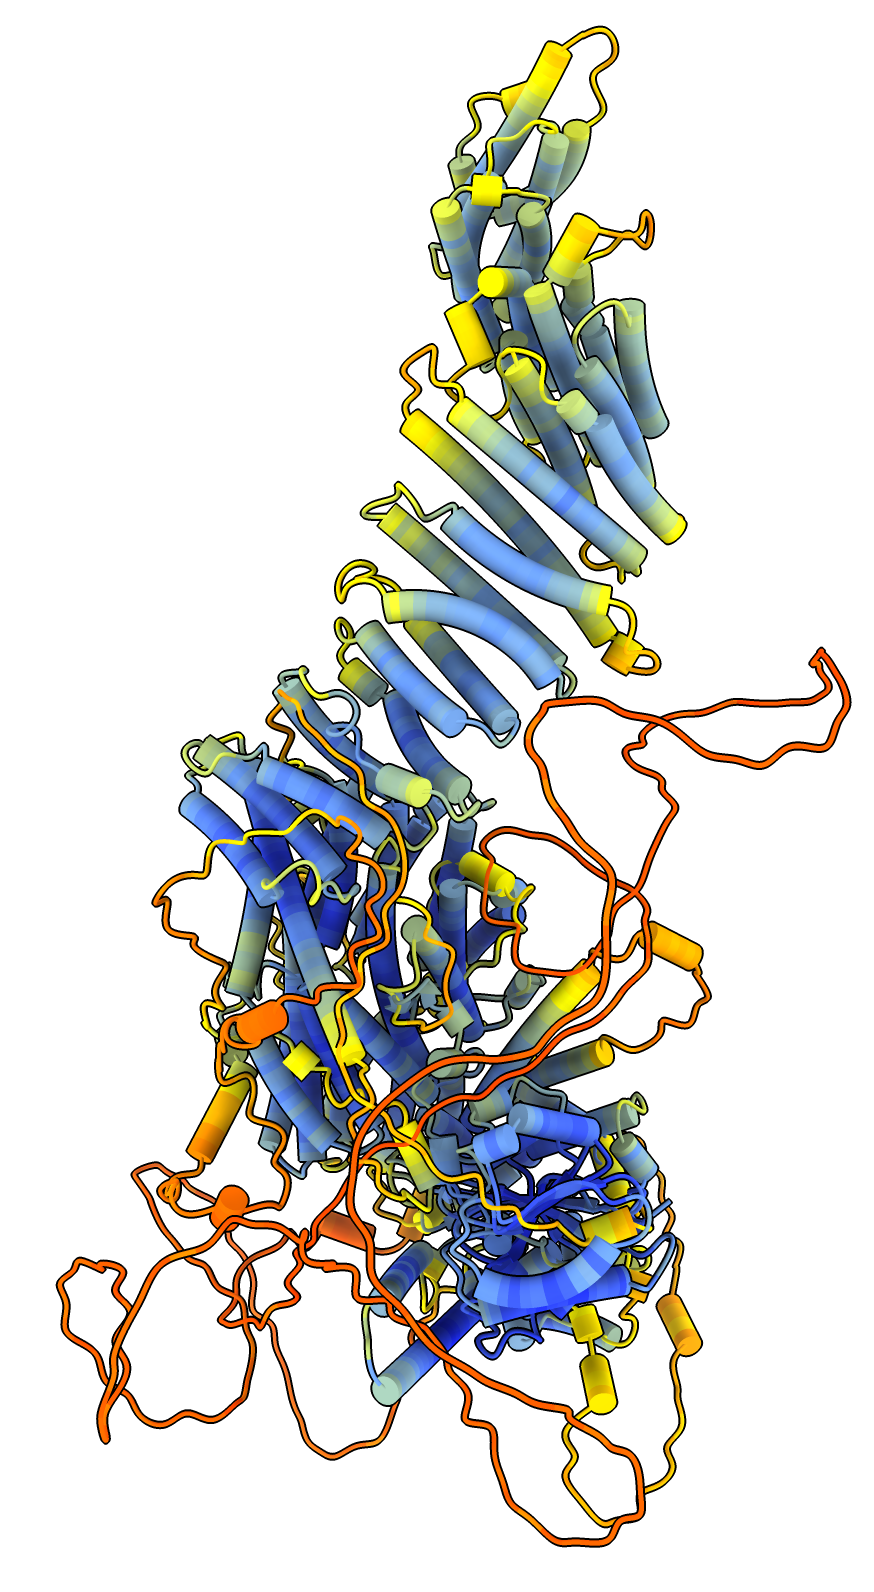
| 
| 
|
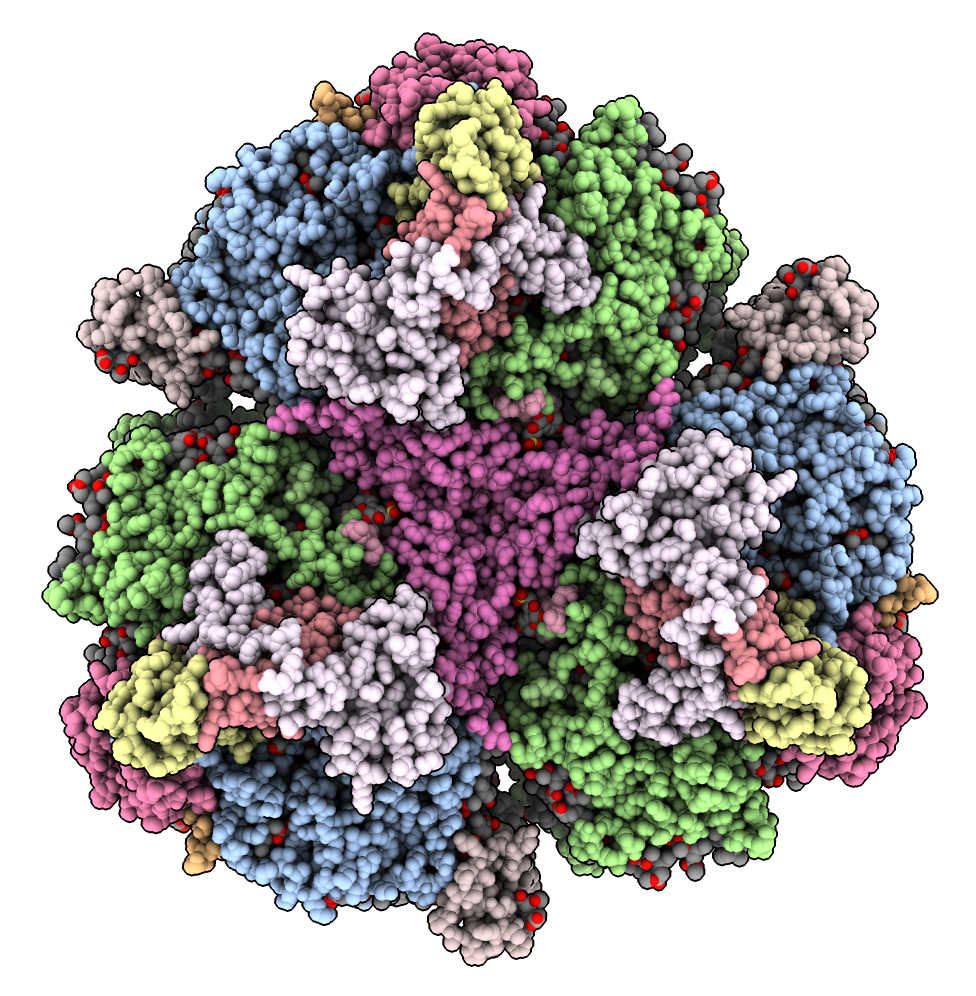
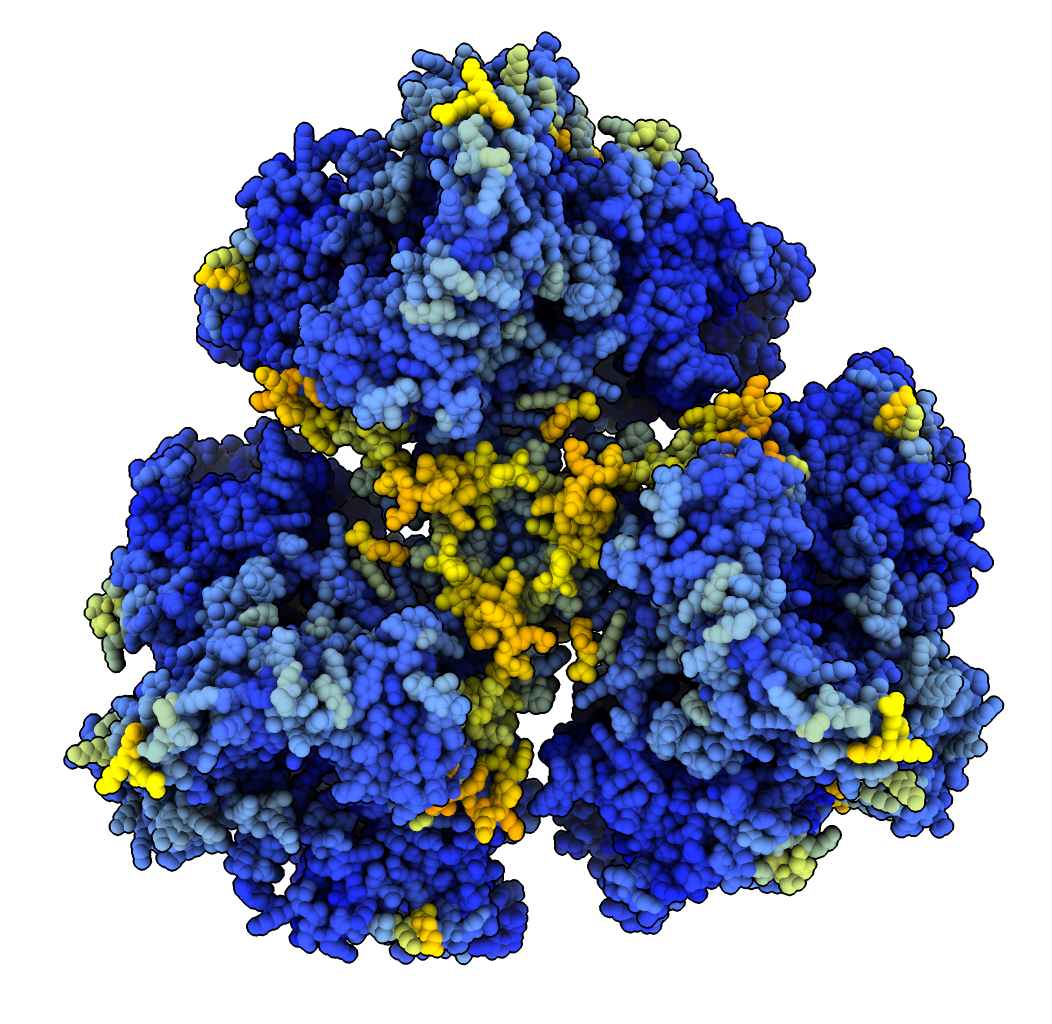
Trimeric photosystem I complex from cyanobacterium, PDB 6VPV. AlphaFold database homology models for 7 of the 11 unique proteins are found from rice, maize, arabidopsis, soybean all with less than 1 Angstrom C-alpha RMSD difference to the experimental structure. Some homologs have much shorter sequences than the experimental structure.
ChimeraX commands to fetch the PDB and AlphaFold models and show helices as cylinders
  open 6vpv
  color #1 bypolymer
  alphafold match #1
| ||||||||||||||||||||||||||||||||||||||||||||||||||||||||||||||||||