Introduction to ChimeraX for cryoEM Atomic Structures
Tom Goddard
Introduction to using ChimeraX to analyze cryoEM maps and atomic models.
We will look at recent mouse insulin receptor structures published March 31, 2022,
map EMDB 25428
and atomic model PDB
7STH .
Synergistic activation of the insulin receptor via two distinct sites
Topics
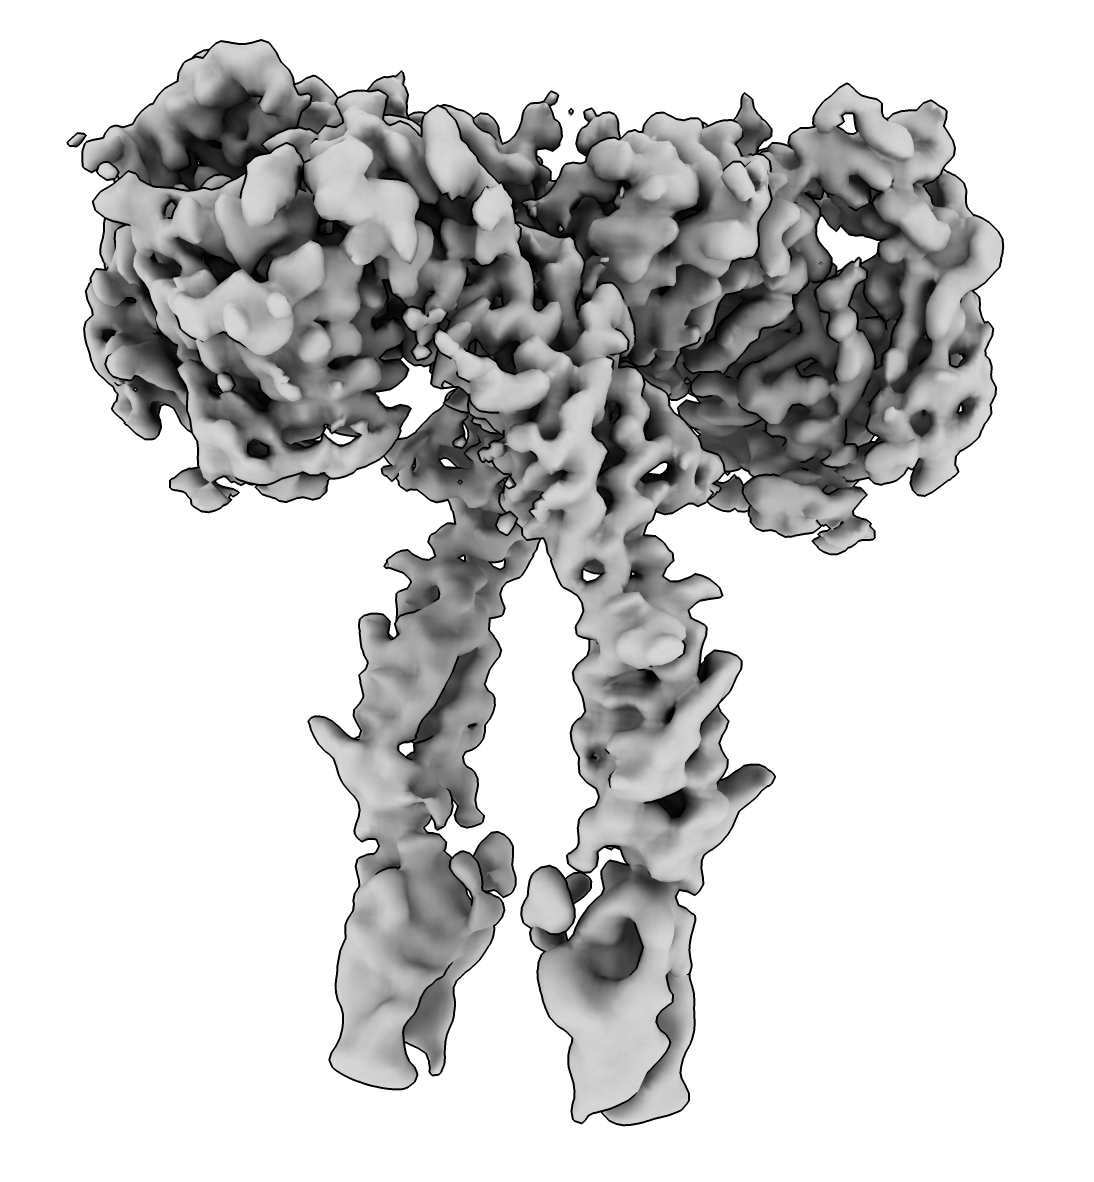
How to look at cryoEM map contour surfaces
Look at EMDB 25428 , 3.5A resolution, 60 MB file size.
open 25428 from emdb
Adjust threshold with histogram slider or command
volume #1 level .03
Adjust step size to show full resolution.
volume #1 step 1
Use soft lighting from toolbar for shadows.
light soft
Save image with toolbar snapshot button.
save irmap.png
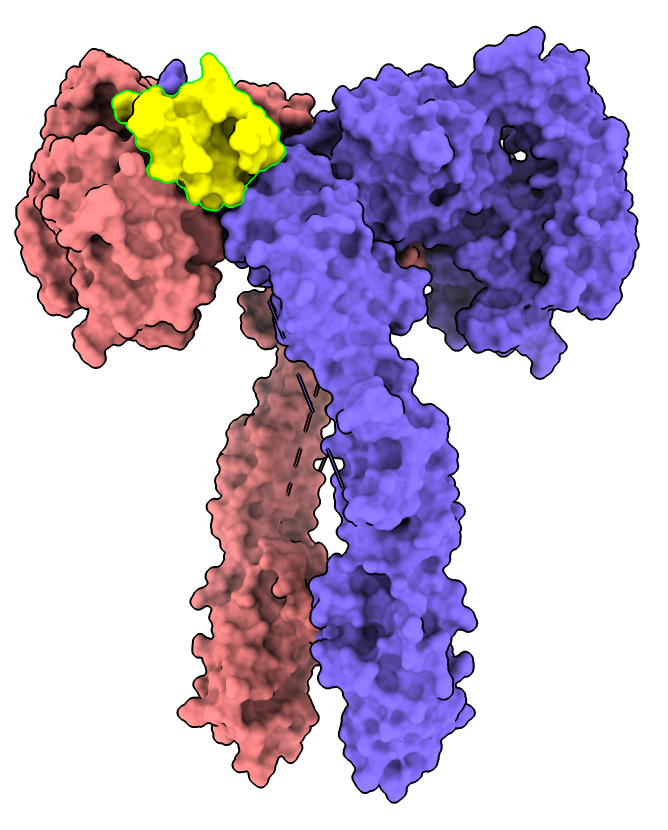
Working with atomic models
Open atomic model that was built into map
open 7sth
Undisplay map with Models panel or command
hide #1 model
Color by chain with Molecule Display toolbar or
color #2 bychain
Show surfaces with Molecule Display toolbar or
surface #2
Select insulin chain D with link in log or
select /D
Color insulin yellow with menu Actions / Color / yellow or
color sel yellow
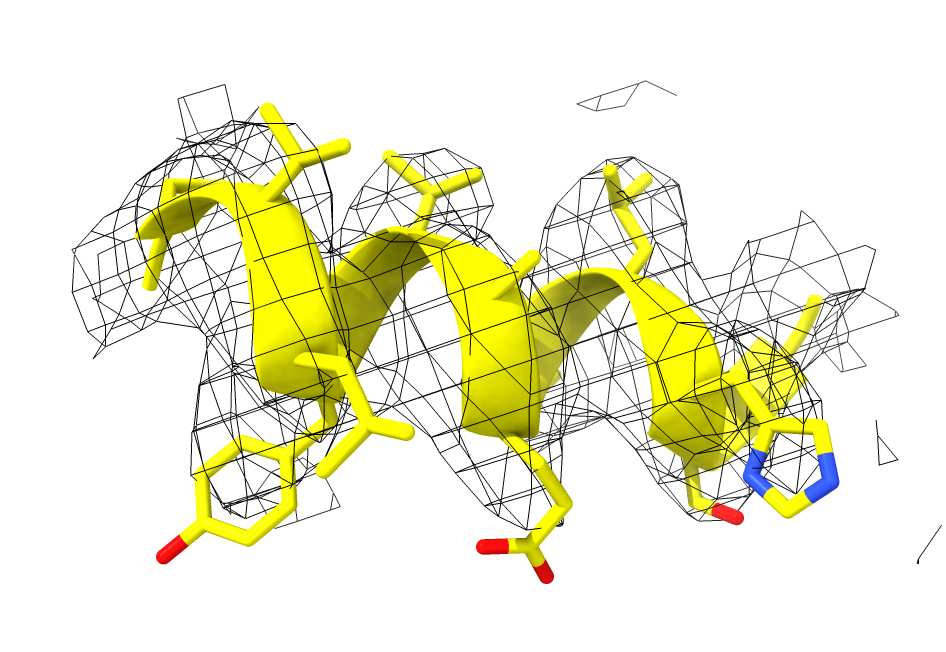
Show map quality near atomic model
Look at map near one helix of insulin.
Clear selection with menu Select clear
select clear
Hide surfaces with Molecule Display toolbar.
hide #2 surface
Select one insulin helix with ctrl-click on ribbon followed by up arrow key
select /D:8-19
Hide ribbon except for selected helix
hide ~sel ribbon
Show map with Models panel
show #1 model
Use menu Tools / Volume Data / Surface Zone near selected atoms
volume zone #1 near sel range 3
Change map style to Mesh in Volume Viewer panel
volume #1 style mesh
Show atoms of helix with menu Actions / Atoms / show
show sel
Color nitrogens blue, oxygens red with Molecule Display toolbar color heteroatom
color sel byhet
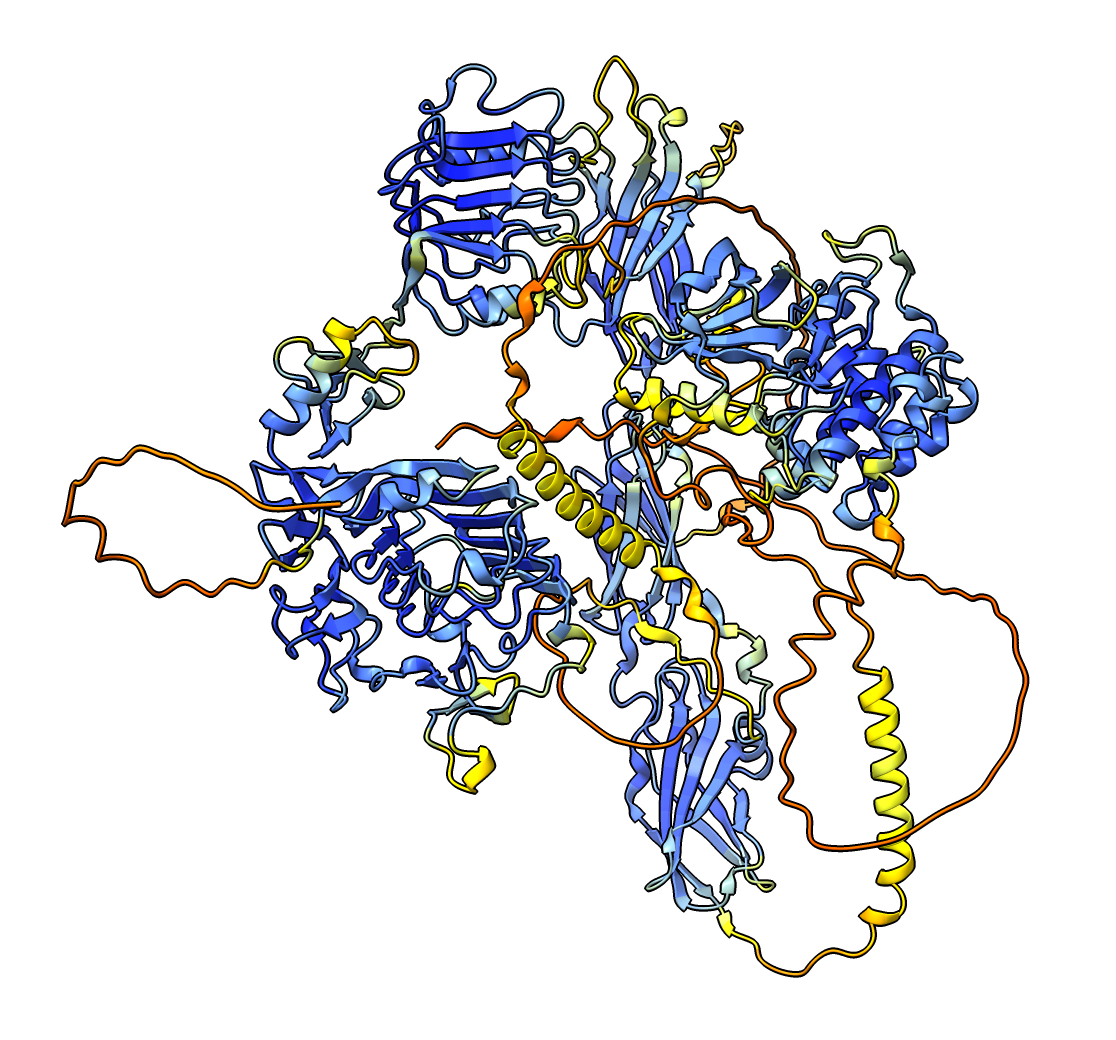
Using AlphaFold Database atomic models
Use an AlphaFold model to start building an atomic model from the map.
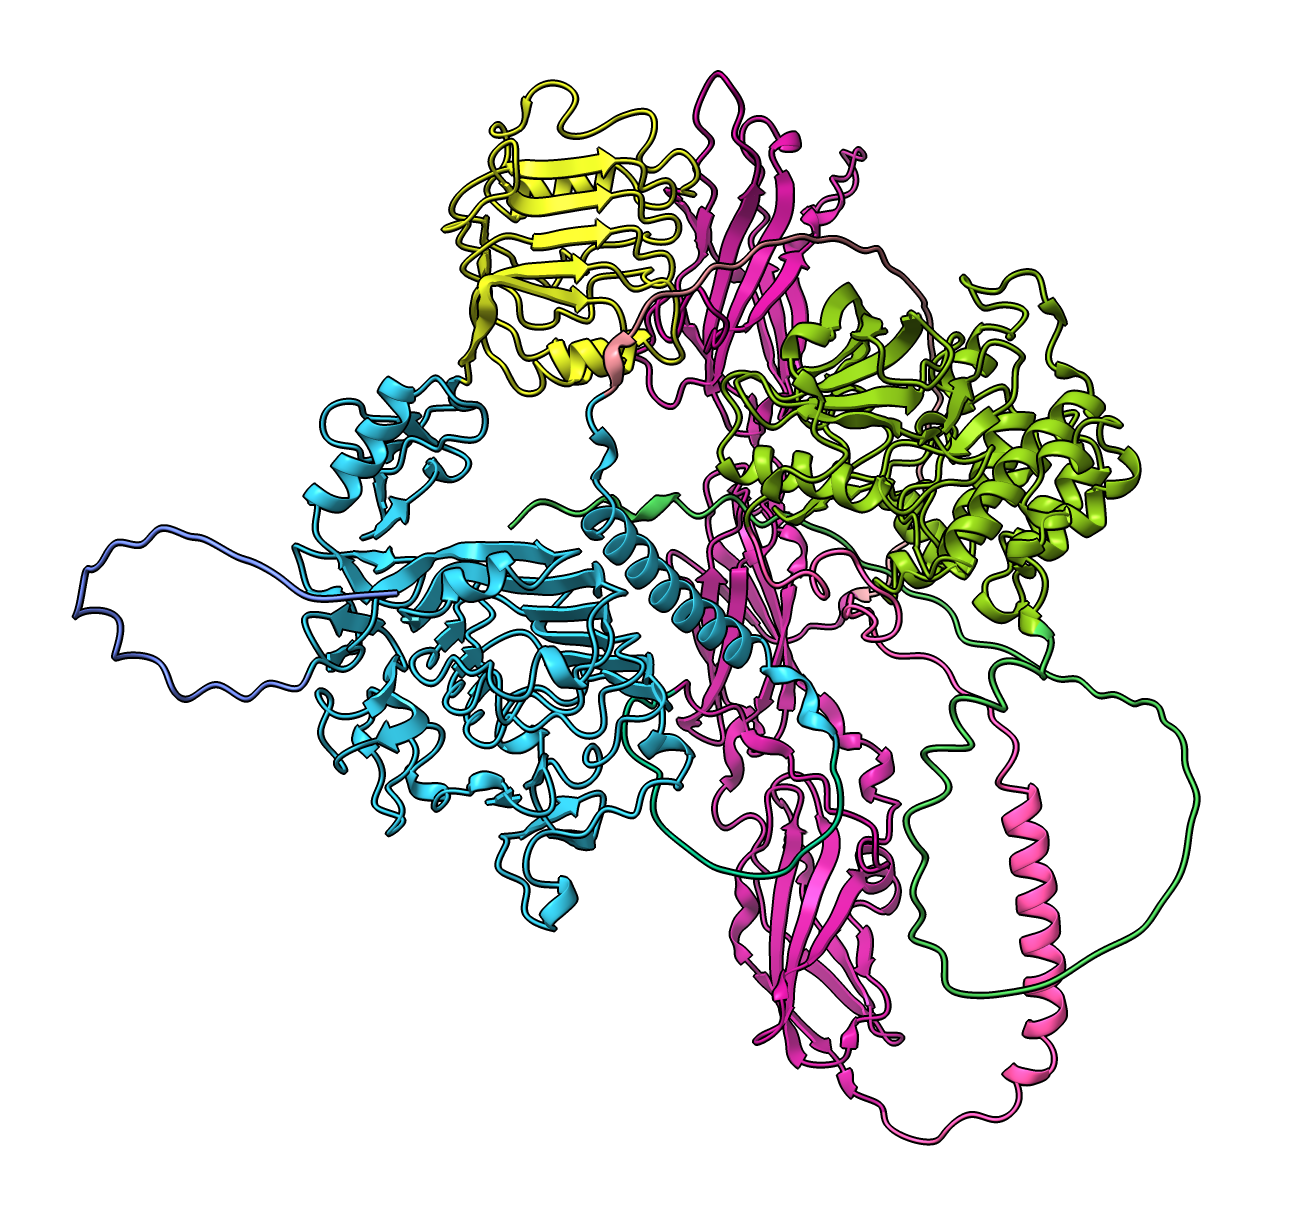
Fetch AlphaFold prediction for UniProt INSR_MOUSE using
menu Tools / Structure Prediction / AlphaFold .
alphafold match INSR_MOUSE
AlphaFold per-residue confidence coloring: high blue, low red.
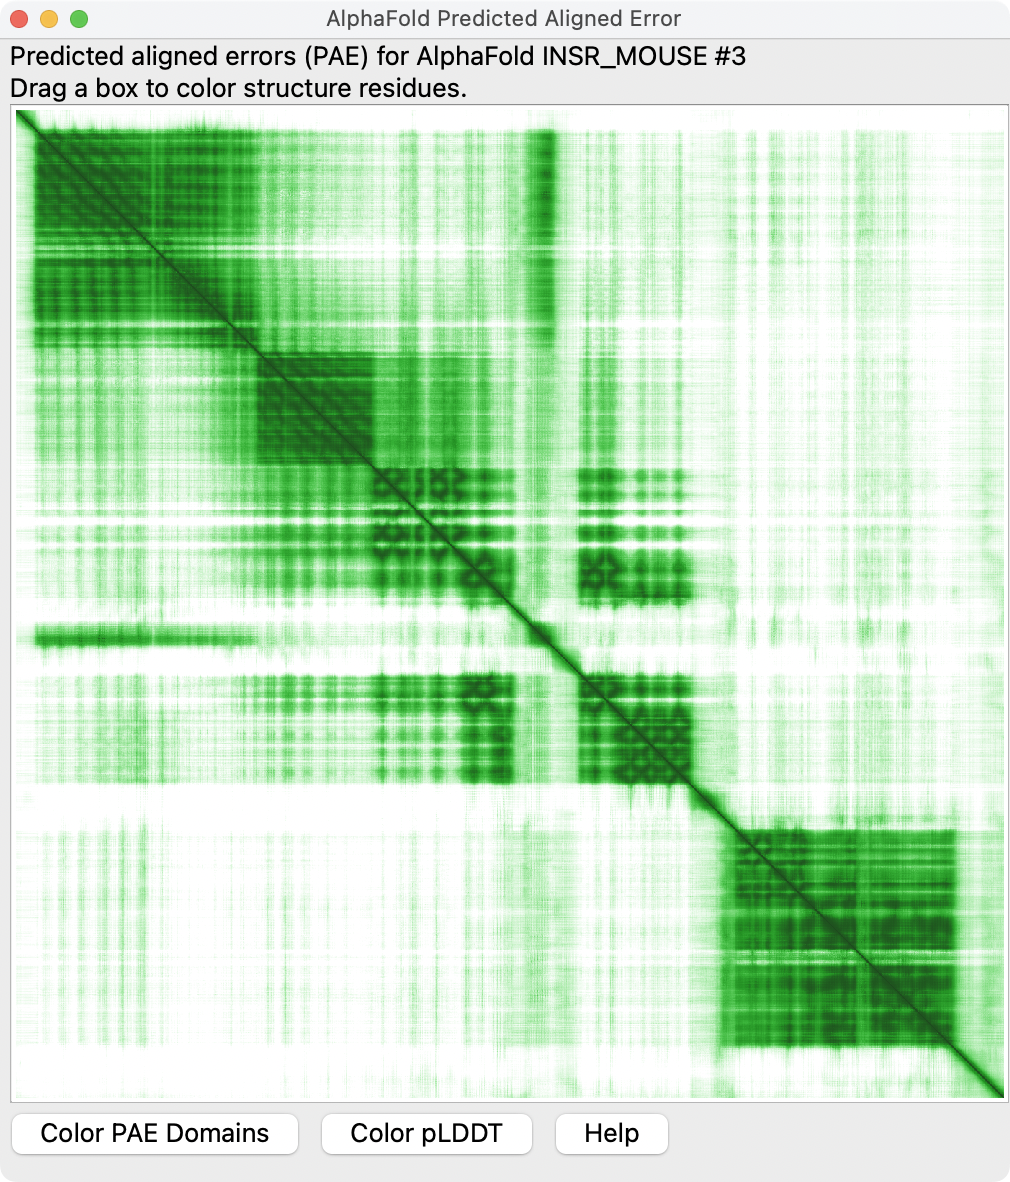
Show AlphaFold predicted aligned error (PAE) plot with AlphaFold panel Error Plot button.
alphafold pae #3 uniprot INSR_MOUSE
Color PAE domains using button on PAE plot.
AlphaFold is not confident of the packing of different colored domains.
alphafold pae #3 colorDomains true
Blue, yellow and pink domains are extracellular and in map. Green is cytoplasmic kinase not in map.
Fitting atomic models in maps
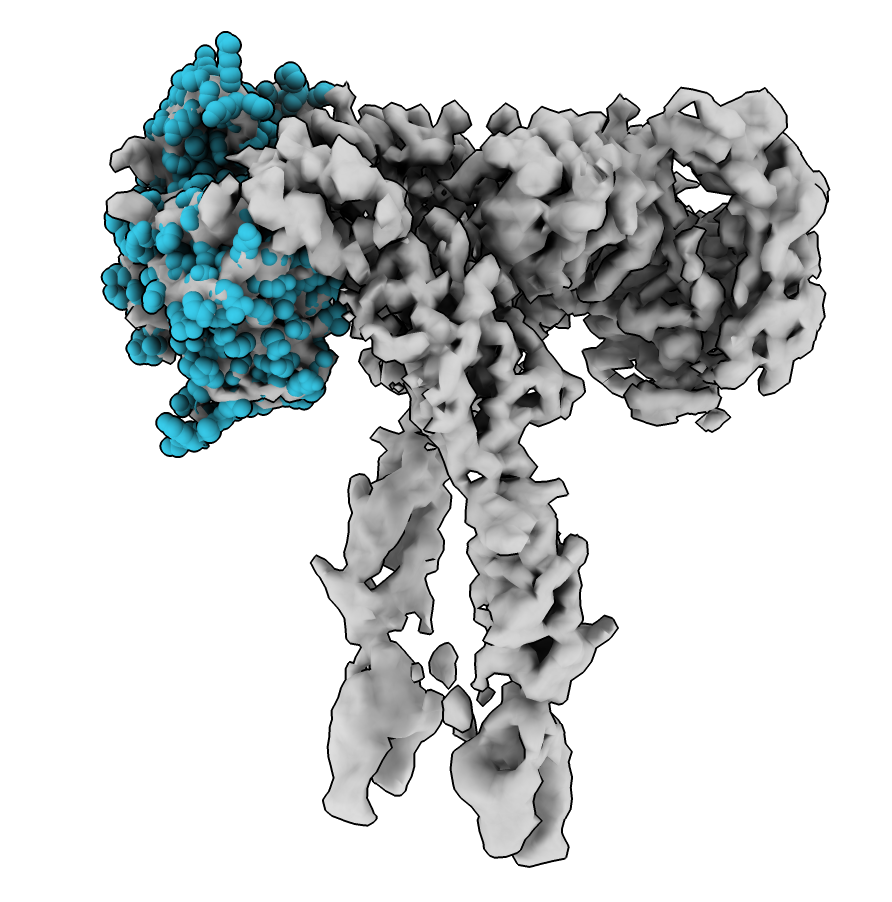
Fit blue AlphaFold domain in map.
Delete residues outside blue domains 28-336.
delete #3:1-27,337-end
Redisplay full map as surface.
volume unzone ; volume style surface
Move blue domain into map with Move Model mouse mode from Right Mouse toolbar .
ui mousemode right "translate selected models"
Ctrl click blue ribbon to select it.
select #3
Move blue domain into map with right mouse (on Mac Option key + trackpad drag). Hold Shift key to rotate.
Use Fit button on Map toolbar to optimize position in map.
fitmap #3 in #1
Show atoms as spheres to see fit better. Clear selection (ctrl-click background) then Molecule Display toolbar show atoms and sphere style.
select clear ; show #3 ; style #3 sphere
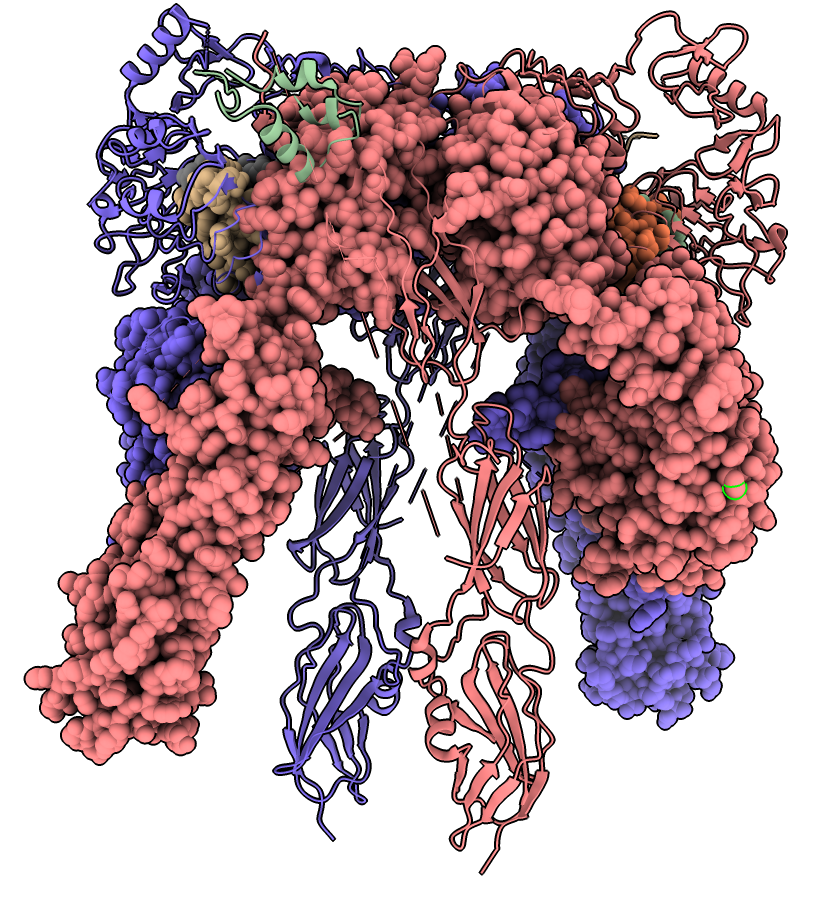
Morphing between atomic models to view conformational changes
Above article describes 10 conformations of insulin receptor.
Open inactive form of receptor, PDB
7SL1 .
open 7sl1
Show 7sth atomic model and hide map and alphafold model.
show #2 model ; hide #1,3 model ; show #2 ribbon
Color by chain using Molecule Display toolbar.
color bychain
Select atom of 7sl1 and align it by hand with move model mouse mode.
Calculate morph using command
morph #2,4 same true
Reset morph slider to start and press Record button (red circle) to record a movie.
movie record ; coordset #5 ; wait 50 ; movie encode
Separation of intracellular kinases inactivates them.