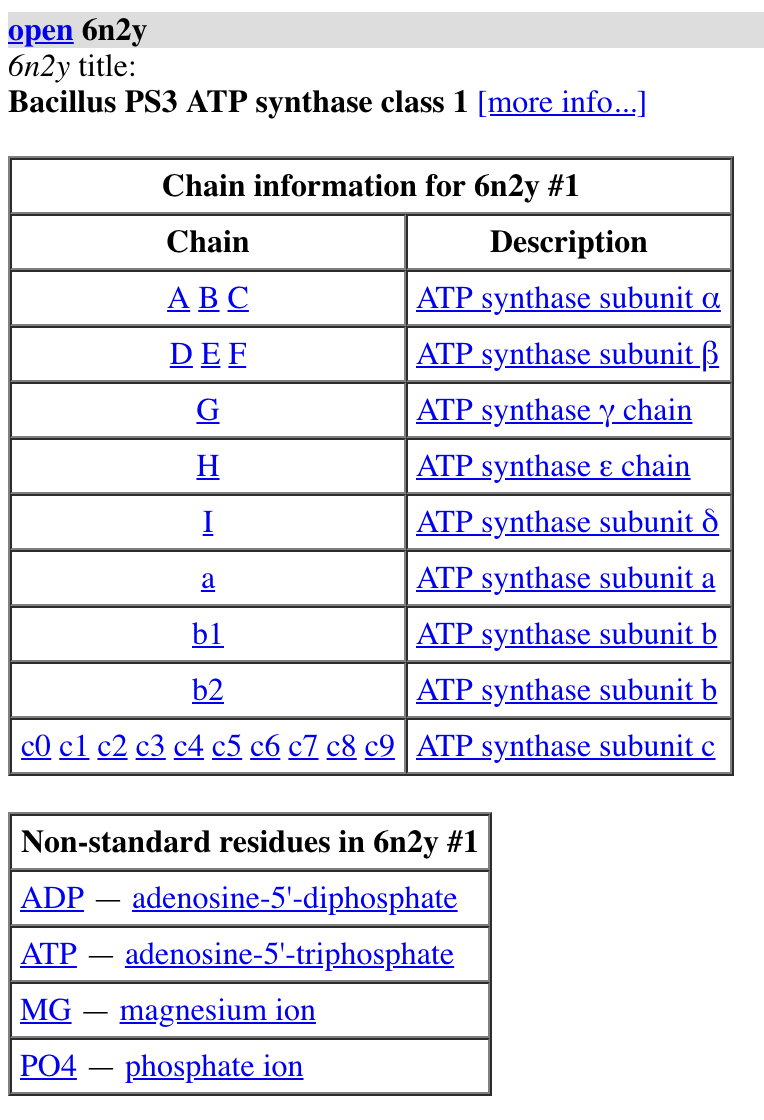
open 6n2y
sequence chain #1/A
Turn off 3-finger mission control on Mac in system preferences Trackpad / More Gestures.
Mouse, left rotate, right translate, scroll to zoom.
log metadata #1
Tom Goddard
January 15, 2020
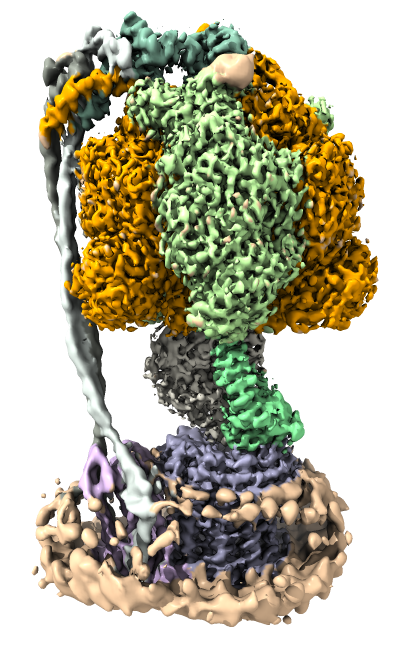
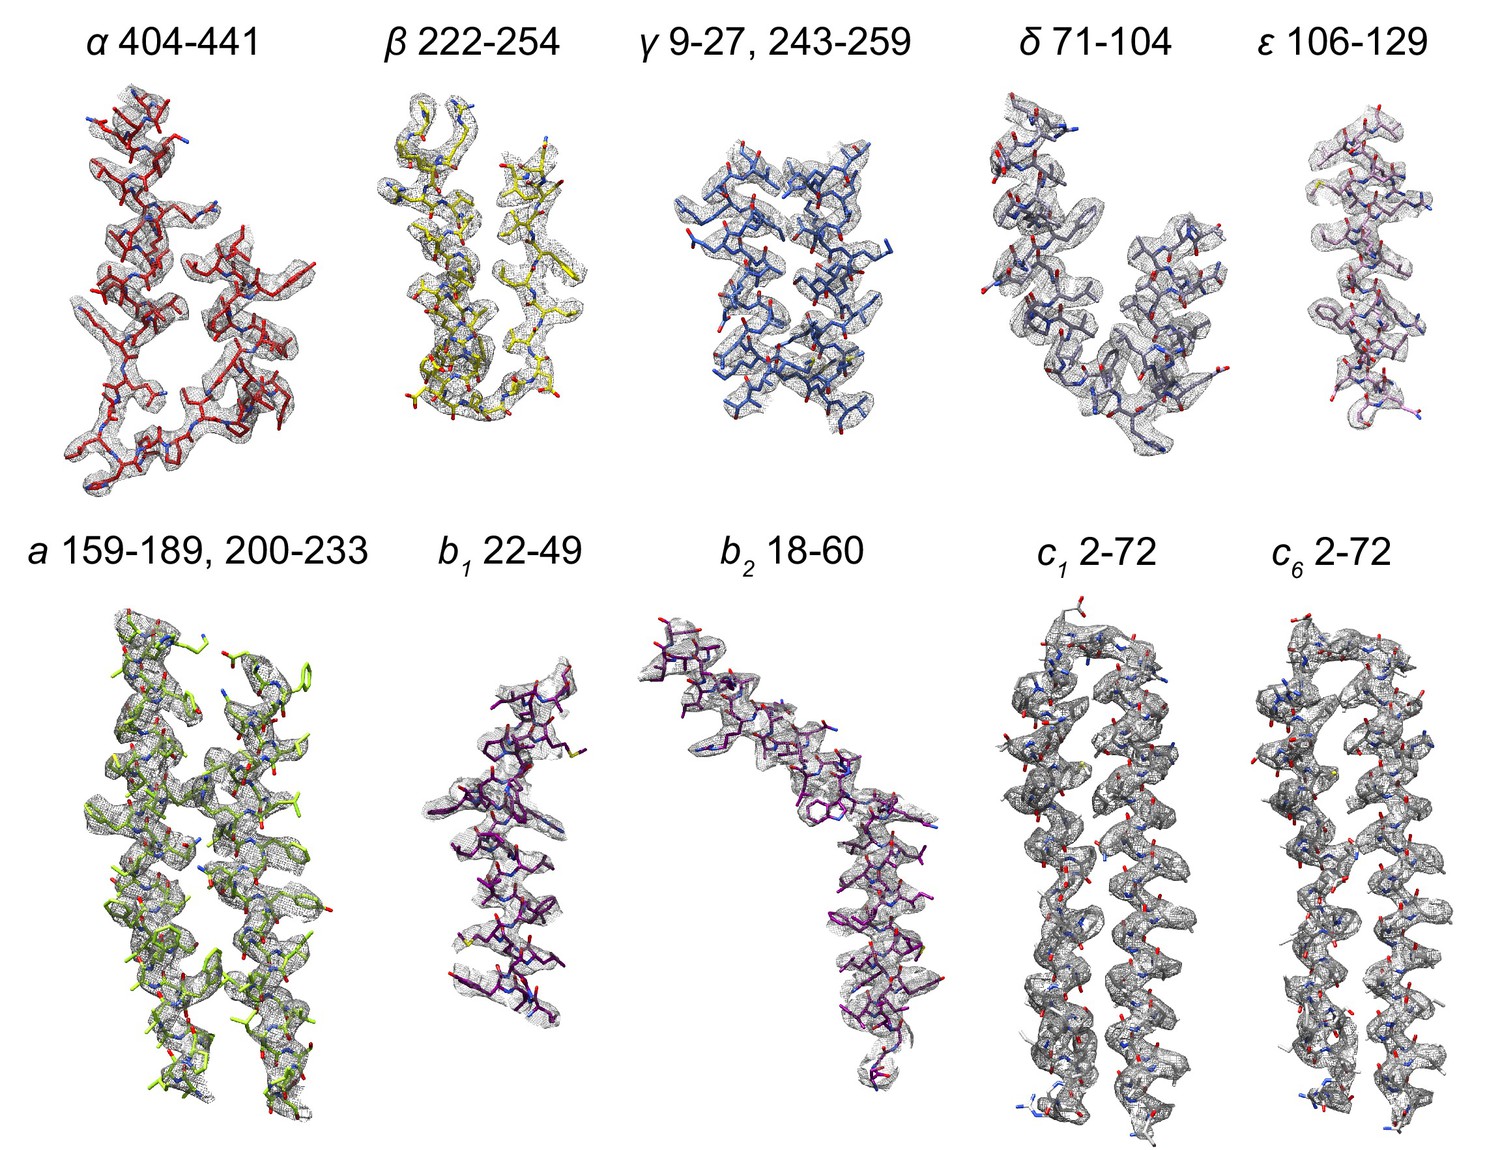
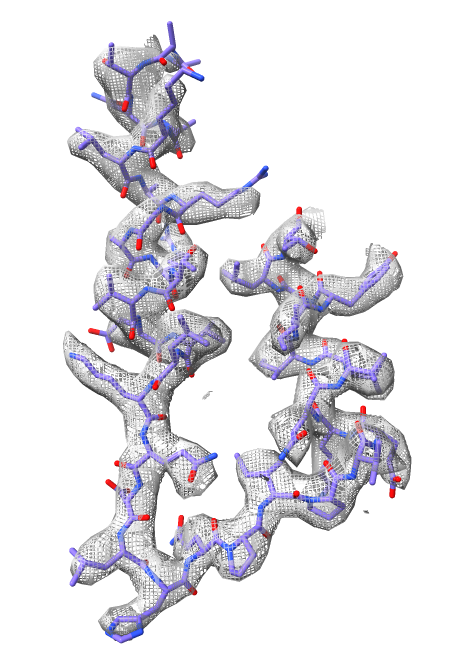
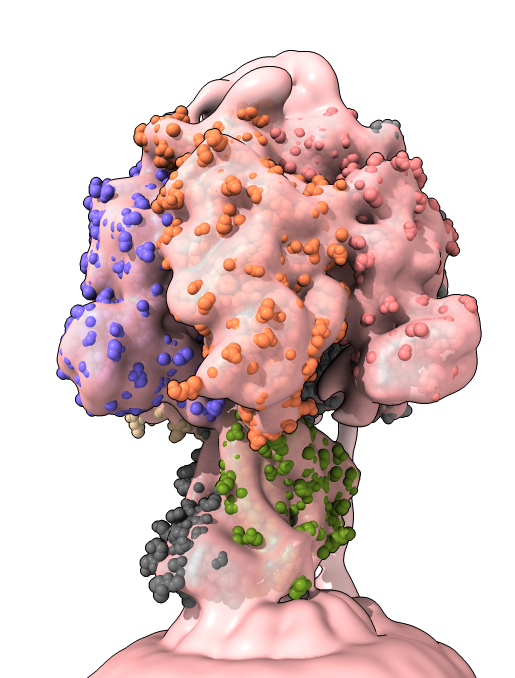
This ChimeraX tutorial will look at how to visualize atomic models and maps of three conformations of a bacterial ATP synthase determined by cryoEM at 3.0 and 3.2 Anstrom resolution. We will create views of the data similar to those found in
      Structure of a bacterial ATP synthase.
      Guo H, Suzuki T, Rubinstein JL.
      Elife. 2019 Feb 6;8. pii: e43128. doi: 10.7554/eLife.43128.
Atomic models PDB 6n2y, 6n2z, 6n30. EMDB maps 9333, 9334, 9335. ChimeraX can fetch these data files directly from the PDB and EMDB or you can download the files for offline use.
Command links in this page will execute in ChimeraX if this web page is displayed within ChimeraX. To show this tutorial in ChimeraX use menu entry Help / Documentation Index, choose Tutorials, and select the January 2020 cryoEM tutorial.
open 6n2y
sequence chain #1/A
log metadata #1
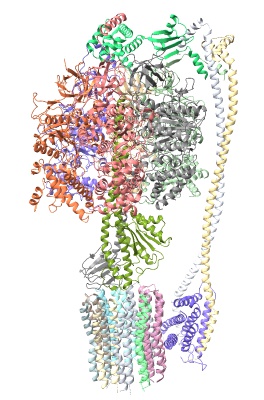
	  hide atoms
	  show cartoons
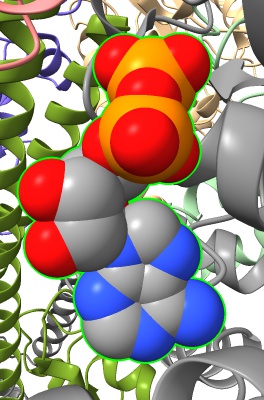
	  select :ADP
	  show sel atoms
	  style sel sphere
	  select /H
	  color sel red
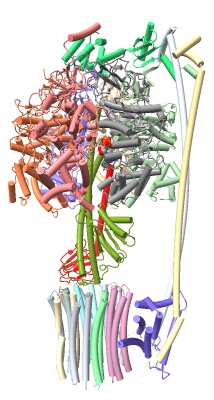
	  preset cylinders
	  save ~/Desktop/image1.png
	  preset ribbons
	  open 6n2z
	  open 6n30
morph #1,2
	  hide cartoon
	  show atoms
	  light simple
	  coordset #4 1,21
close #4
morph #1,2,3 wrap true same true
movie record ; coordset #4 1,61 ; wait 61 ; movie encode
	  close #2-4
	  show #1 model
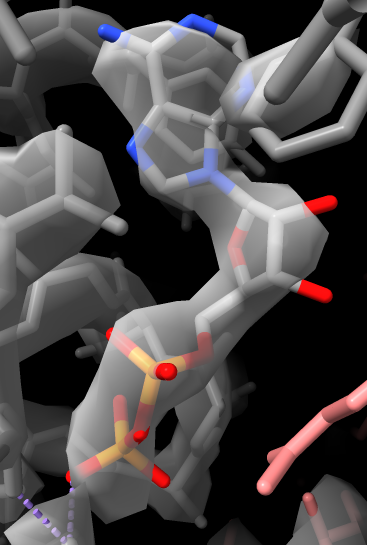
open 9333 from emdb
	  show atoms
	  style stick
volume #2 step 1
transparency 50
view :ADP
volume #2 level 3
volume #2 style mesh
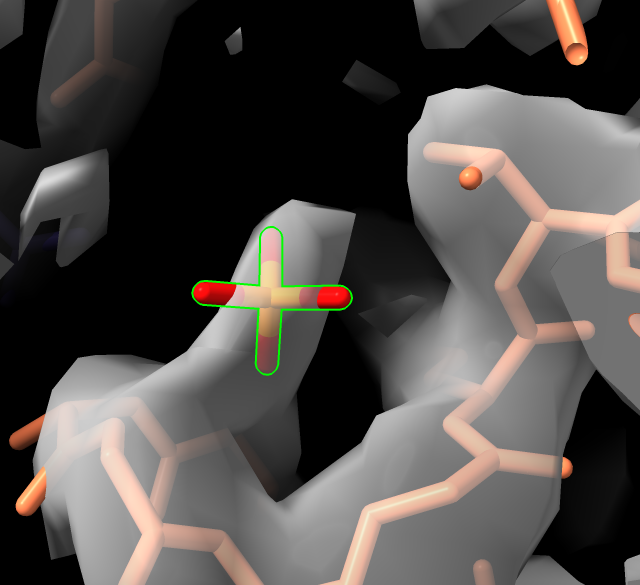
view :PO4
volume #2 level 1
view
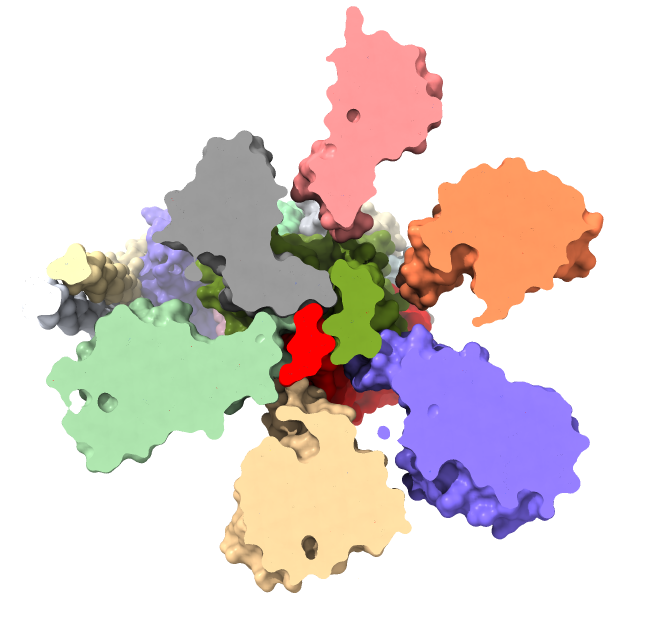
surface zone #2 near #1/A:404-441
	  hide #1
	  show #1/A:404-441
	  view
color byhetero
volume #2 style mesh
	  volume #2 subdivide true
	  volume #2 subdivide true subdivisionlevels 2
volume #2 level 1.5
set bg white
	  vol #2 subdivide false
	  surface unzone #2
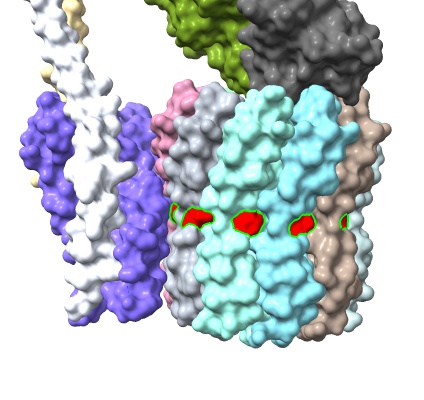
open 4xd7
select #3
	  mousemode right "translate selected models"
	  mousemode right "rotate selected models"
	  view matrix models #3,0.15538,-0.72458,0.67144,118.99,0.67504,-0.41837,-0.60769,155.34,0.72124,0.54767,0.42412,175.3
fit #3 in #2
	  volume gaussian #2 sdev 3
	  fit #3 in #4
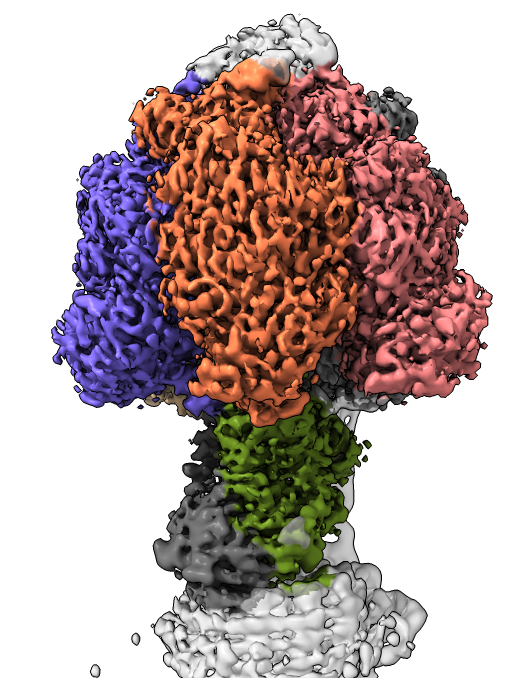
	  close #4
	  show #2 model
	  transparency 0
	  color zone #2 near #3 dist 8
	  hide #3 model
| 
|
| Proton intake channel. | Proton outlet channel. |
close #2,3
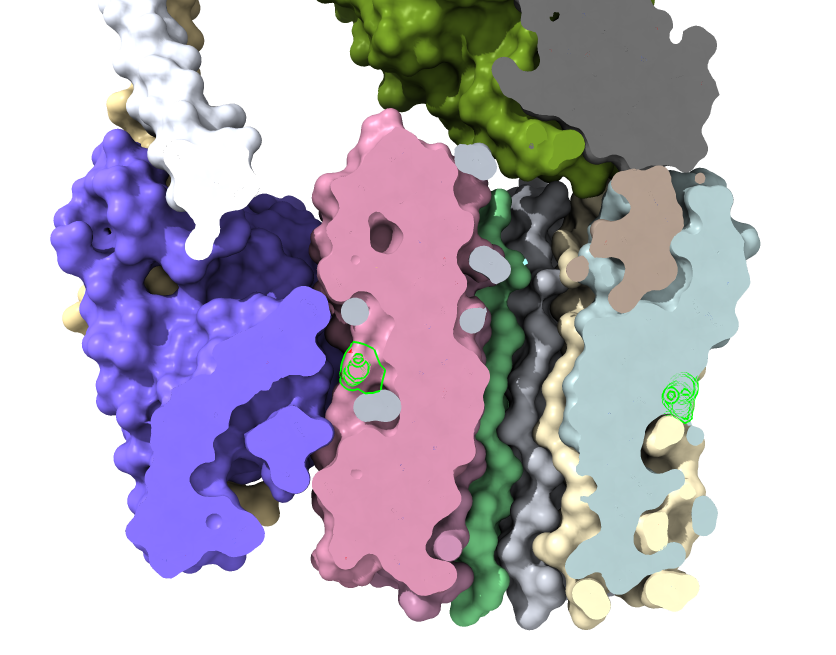
	  show #1 atoms,model
	  select /c*:56
	  style sel sphere
surface #1
color sel red
mousemode right clip
light simple
clip position 163,163,194 axis -.99,-.08,-.13 coord #1
clip back 0 position 147,162,192 axis .99,.08,.13 coord #1
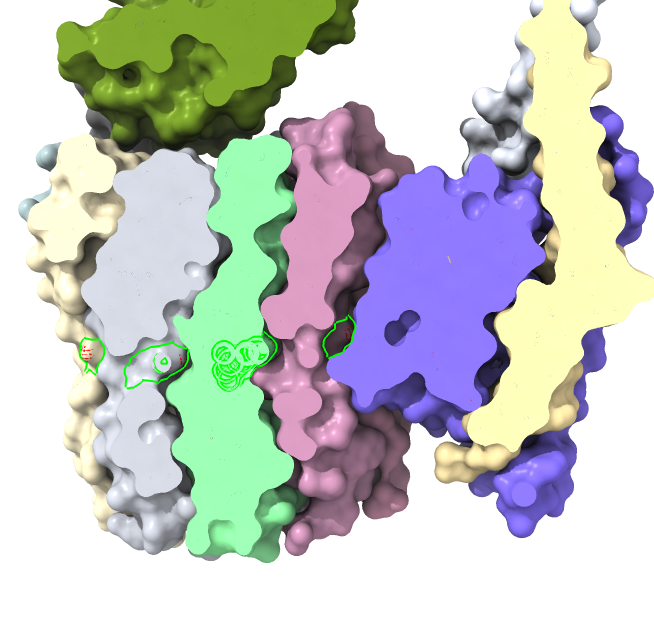
light soft
	  clip off
	  light simple
color /H red
clip axis 0.03,0.13,-0.99 position 164,161,206 coord #1