
This tutorial provides a step-by-step approach to allow you to explore some of the features of the structureViz2 Cytoscape app as you investigate the structural relationships between some members of the amidohydrolase enzyme superfamily. In particular, this tutorial will focus on those proteins that have been identified as phosphotriesterases (PTE) by PFAM. The sample data is from the Structure-Function Linkage Database 1 (SFLD), which categorizes these proteins into two subgroups: phosphotriesterase-like and unknown119. While the unknown119 proteins show close sequence similarity to the phosphotriesterases, they are known to not hydrolyze organophosphates 2. In this tutorial, we look at these two subgroups, and explore the structural similarity between the phosphotriesterases and the single available structure for the unknown119 subgroup. Along the way, we'll explore how to use structureViz2 as a front-end to UCSF Chimera 3 and an agent to bridge between Cytoscape 4 and Chimera.
There are three major components to structureViz2. First is Cytoscape, which provides the foundation for structureViz2 as well as the tools to visualize biological networks, whether they be metabolic, regulatory, interaction, or similarity networks. All of these biological networks are visualized in the same way, but the edges imply very different relationships. In the example we will use below, we will be dealing with a similarity network.
The second component is the structureViz2 app itself. This is a Cytoscape app that acts as an interface, or bridge between Cytoscape and Chimera. It also provides an alternative interface to Chimera by taking advantage of the Tree widget provided by Java. For many operations, this is a more intuitive way to browse the components of a structure, although the normal Chimera menus and command line interface are available for more advanced interaction.
The third component is Chimera, which is an interactive molecular visualization and analysis system. Chimera provides the visualizations and tools required to deal with molecular structures. A relatively recent version of Chimera (version 1.8 or newer) is required to interact with structureViz2.
An optional supplementary component is the RINalyzer app, which provides a number of important methods for visualizing, exploring, and analyzing residue interaction networks (RINs).
Cytoscape is available for download from the Cytoscape web page. Cytoscape is a platform-independent Java application, but to ease installation, it is available in platform-specific bundles that generally do a very good job of installing Cytoscape in the appropriate place on your machine. Once you get to the download page (after agreeing to the license), select your platform under Option 1. Once you have downloaded the installer, execute it (double-click on Windows or MacOS X, execute with a shell under Linux or Unix).
structureViz2 is available for download from the Cytoscape App Store. Download the structureViz2 "jar" file. Install it as follows:
The RINalyzer app is available from the RINalyzer download page. Download the RINalyzer.jar file and install it as described above for structureViz2.
Chimera is available for download from the Chimera downloads area. Remember that you will need version 1.8 or later to use structureViz2. Download the appropriate installer for your platform and install Chimera on your machine.
A sample XGMML network is available with information about the PTE family. You can either:
The nodes in this network represent the proteins in the two subgroups, and the edges contain information about the E-values calculated using the UCSF Shotgun program5. The edge data was taken into consideration by using the Cytoscape edge-weighted, spring-embedded layout algorithm (Layout→Edge-weighted Spring Embedded→BlastEValue).
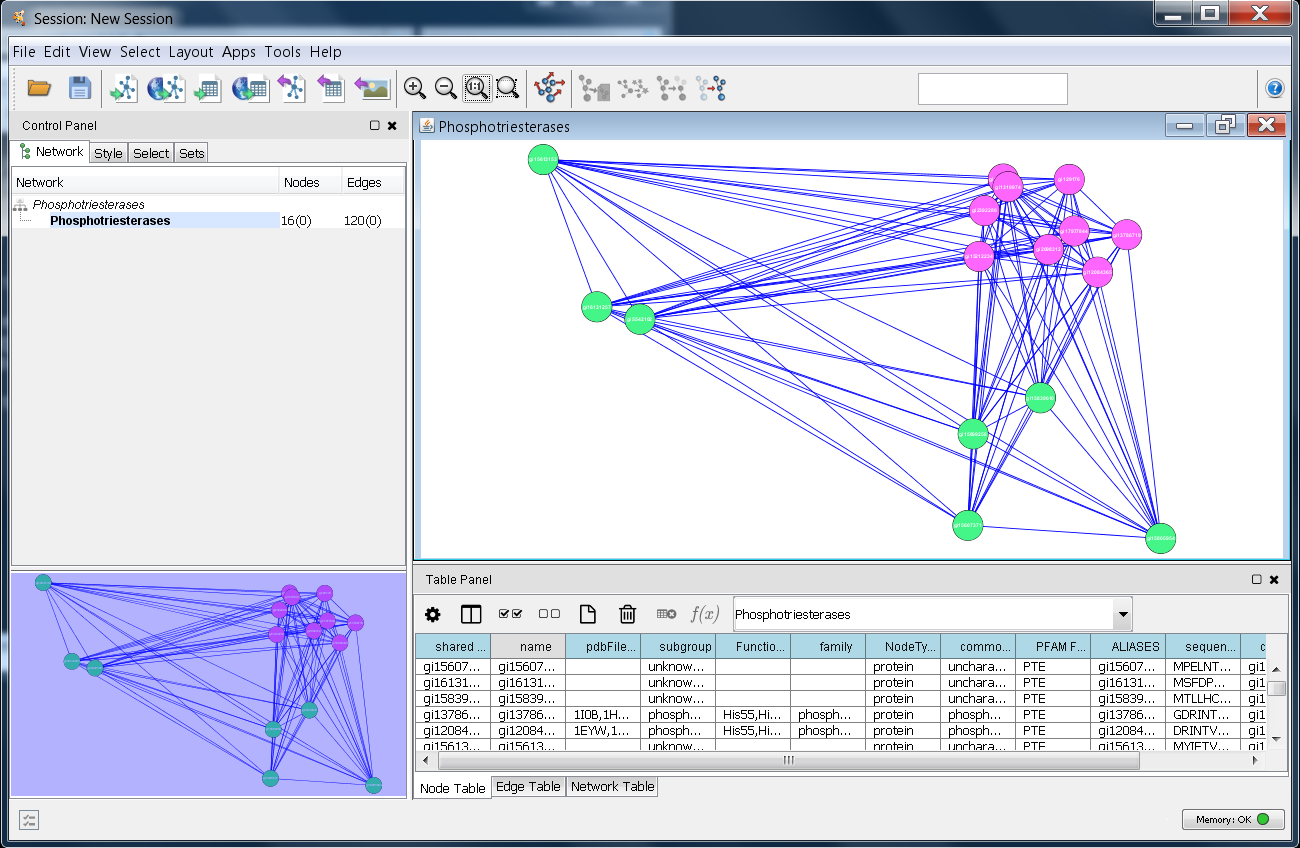
Once you have successfully loaded the file, Cytoscape should look similar to the image at the right. The next step is to see if structureViz2 is loaded correctly, and test connectivity to Chimera. Begin by selecting a number of nodes in the Cytoscape window (just use your mouse with the first button pressed, and drag over all of the purple nodes). The selected nodes should turn yellow. Now, see if structureViz2 can find any of the attributes by getting a list of structures: Apps→structureViz→Open Structures for Node(s). This should display a list of structures. If the structureViz menu isn't available, then structureViz2 was not correctly installed. If the menu item is not enabled or no PDB structure IDs are shown in the list, then the network was not correctly loaded.
If everything works, go ahead and select the structure 1EZ2, which is one of the structures for phosphotriesterase, GI 2098312. If you get error messages in the Cytoscape console or nothing happens after several seconds, it probably means that the Chimera application is not on the default path. This is common for MacOS X, but could also happen in Linux and Unix installations. In this case, go to the next step. If Chimera came up, go to the step on "Browsing and manipulating structures".
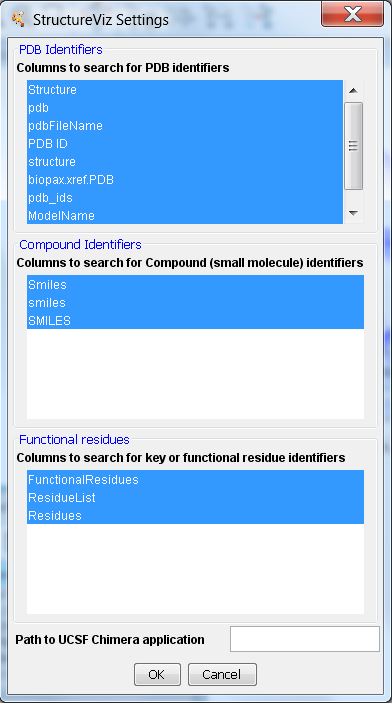
Depending on your installation, it might be necessary to tell structureViz2 exactly where the Chimera binary is. This is done by adding the path in the structureViz Settings... (Apps→structureViz→Settings...). Note that on the Macintosh this should be the path to the Chimera executable, not the Chimera.app directory. If you install Chimera in your Applications folder (the recommended install location), then set the path to: /Applications/Chimera.app/Contents/MacOS/. Once you have entered the path, click OK. This will "remember" this setting for the current session and Cytoscape installation so that you will not have to set it again unless you have a new installation of UCSF Chimera or a session file that uses another instance of Chimera.
Now that you have set the Chimera path, go back to Initial test and try to load 1EZ2 again.
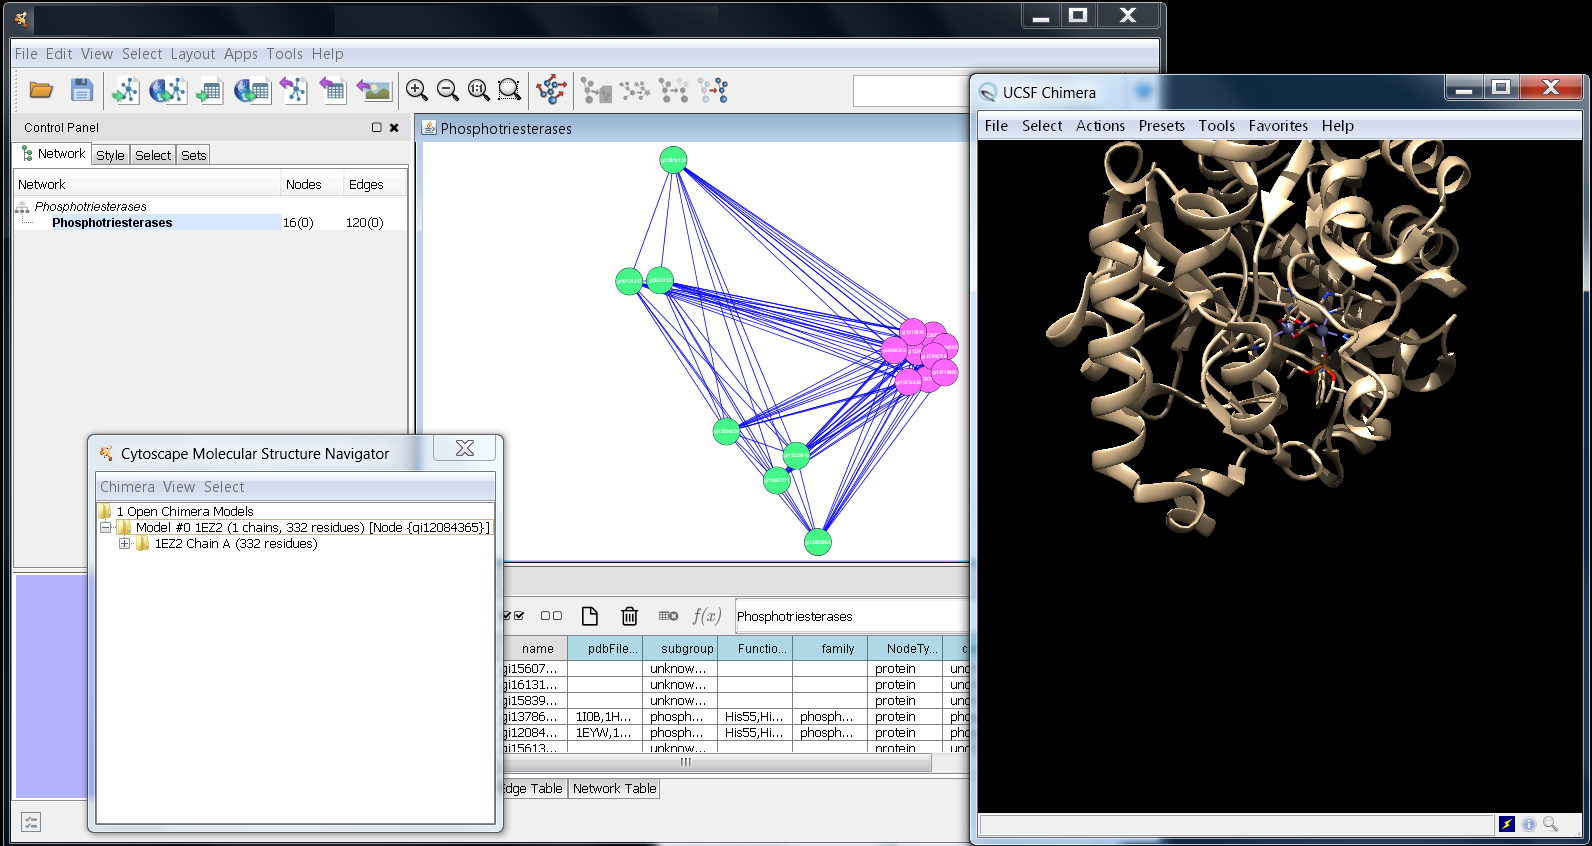
Several things should have happened when you requested structureViz2 to load 1EZ2. First, Chimera should launch, then it will go to the RCSB web site and load the coordinate information for 1EZ2 and display the model. Finally, the Cytoscape Molecular Structure Navigator should pop up. When all three are loaded, you should get an image similar to the one below. You can manipulate the structure using either the menus provided by the Cytoscape Molecular Structure Navigator or by using the menus and commands provided by Chimera directly. To move and scale the structure with the mouse, you will need to interact directly with the Chimera window.
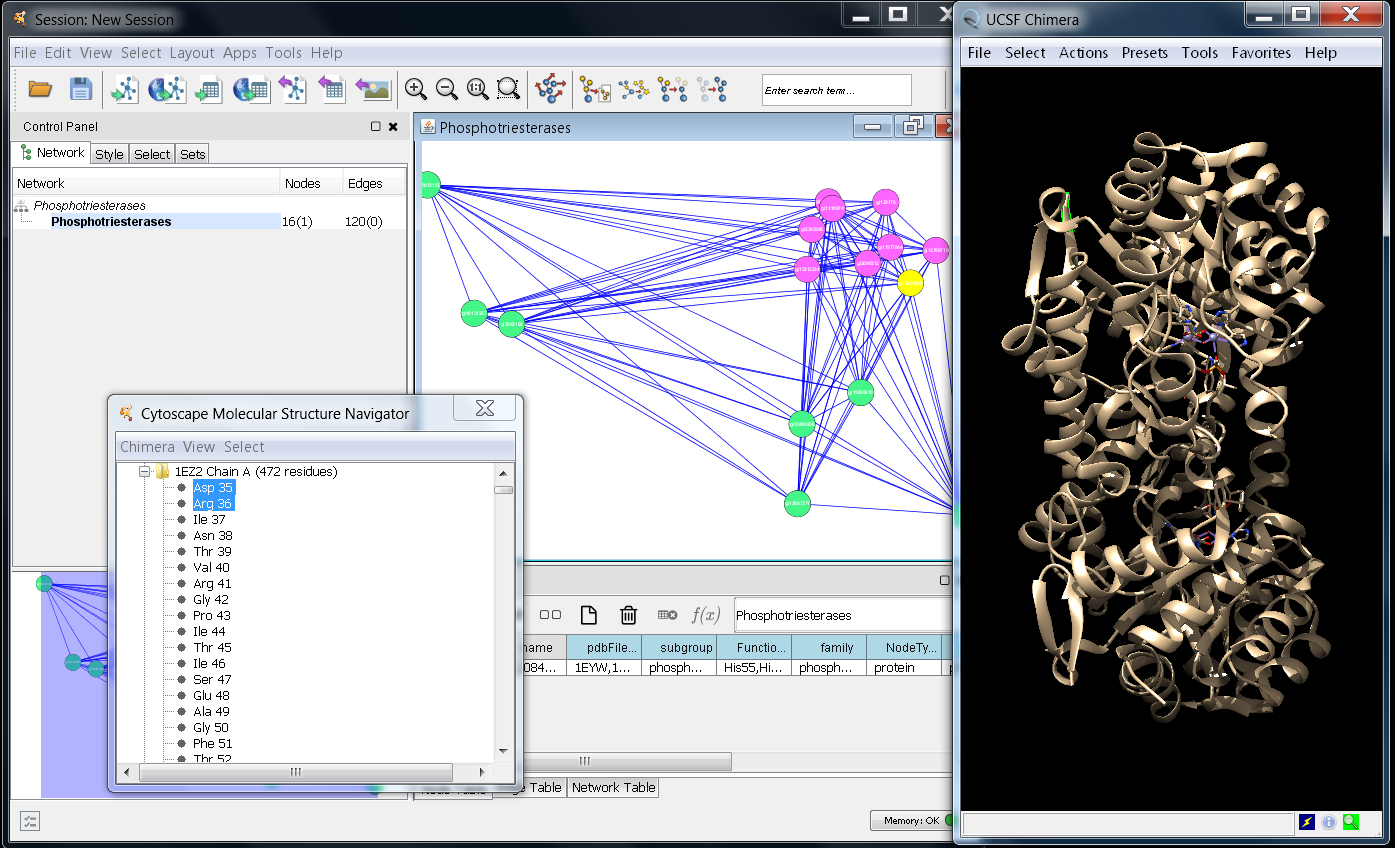 Screenshot showing Cytoscape, the Molecular Structure
Navigator, and UCSF Chimera. (click for a larger view)
Screenshot showing Cytoscape, the Molecular Structure
Navigator, and UCSF Chimera. (click for a larger view)
The Cytoscape Molecular Structure Navigator provides a tree-oriented interface (similar to the Windows file browser or the Macintosh finder). At the top level, all of the models currently loaded are displayed. One level down, within each model is the list of chains, and finally, within each chain is the list of residues. Let's go ahead and explore the structure for 1EZ2. By opening up the model, you can see that there are two chains defined, the two amino acid chains. If you open the first chain and select one of the residues, you should notice three things happen. First, the selected name highlights (as you would expect), second, the residue will be outlined in green in the Chimera window, and third, the node that refers to the 1EZ2 structure (gi12084365) will be highlighted in yellow in the Cytoscape window.
Notice that by default, the residue names use the standard three letter abbreviation. The View menu allows you to set either the full name (View→Residues as→full name), for those of us who constantly confuse asparagine with aspartic acid, or the single letter abbreviation (View→Residues as→single letter). Note that when a display parameter is changed, the tree will need to reload iself so it will return to the initial closed state.
Details on using Chimera's command or menu interface is beyond the scope of this tutorial. Users interested in exploring the features provided directly by Chimera are encouraged to review the Chimera User's Guide. However, because there is no mechanism for moving or scaling the structure from within the Molecular Structure Navigator, some familiarity with manipulating the structure in Chimera using the mouse is critical. The table below describes the default mouse manipulation commands. Detailed information on mouse manipulation is available in the Mouse Manipulation of Models section of the Chimera User's Guide. Note that the table below assumes a three-button mouse. On a Mac with a one-button mouse, buttons 2 and 3 can be emulated with the option and apple (clover) keys, respectively.
| Manipulation | Mouse | Cursor |
| XY rotation | Button 1(left button) within the central region of the graphics window | Small circle |
| Z rotation | Button 1(left button) in the periphery of the graphics window | Two curved arrows |
| XY translation | Button 2(middle button) | Cross formed by two double-headed arrows |
| scaling | Button 3(right button) | Diagonal double-headed arrow enclosing a small square |
| Z translation | Ctrl-Button 2(middle button) | Vertical double-headed arrow |
 Screenshot showing Cytoscape, the Molecular Structure
Navigator, and UCSF Chimera after deletion of Chain B
and the water molecules. (click for a larger view)
Screenshot showing Cytoscape, the Molecular Structure
Navigator, and UCSF Chimera after deletion of Chain B
and the water molecules. (click for a larger view)
As we noted before, the structure 1EZ2 includes two polypeptide chains, numerous water molecules, and two ligands. We want to simplify the structure to improve the visualization of the catalytic pocket as well as prepare the structure for doing alignments. We will do this in several steps. First, we will delete all of the residues that are not necessary for the next steps. Then, we will simplify the chain and change the depiction. Finally, we will visualize the functional residues in the pocket as well as the associated ions.
Start by clearing any selections you made while exploring the structure. The easiest way to do this is by using the Molecular Structure Navigator menu Select→Clear selection.
We only want to retain Chain A; this can be done by opening up each chain and individually deleting the residues, or we can delete the entire chain. Open up the Model so that all of the chains are visible. Move your mouse over the Chain B label and do a Button 3 (or Ctrl-Button 1 on the Mac) to bring up the context menu for the chain. Select Delete selection on the pop-up menu to delete all of the residues in chain B of the structure. You will be asked to confirm (click Yes) and then the menu will collapse. Chain B will be deleted from the Chimera structure as well as from the Molecular Navigator. This will also cause the Model menu to collapse. To delete the water molecules, first select them (Select→Solvent). Then, bring up the context menu, select Delete selection and confirm.
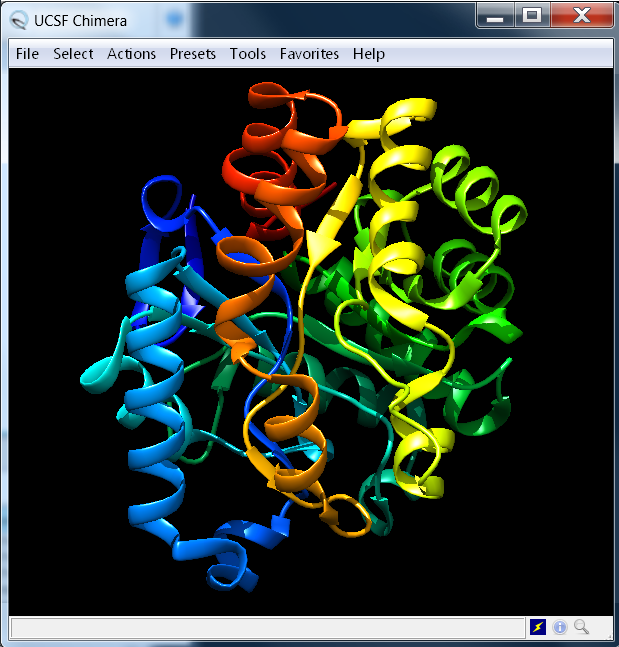 Screenshot showing the ribbon backbone of Chain A of
1EZ2 (click for a larger view)
Screenshot showing the ribbon backbone of Chain A of
1EZ2 (click for a larger view)
You should now be left with a structure in the Chimera window that includes only chain A (see Figure above). Next, we'll use the Cytoscape Molecular Structure Navigator to simplify the display and allow us to focus in on the functional residues.
The final step in visualizing our structure is to view the functional residues and ions in the catalytic pocket. This will utilize many of the same functions we saw before, plus the ability of structureViz2 to use the FunctionalResidues attribute associated with the nodes in Cytoscape. This information is available from the Structure-Function Linkage Database (SFLD) and can be downloaded in a format appropriate for use with Cytoscape.
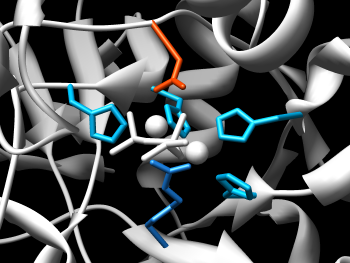
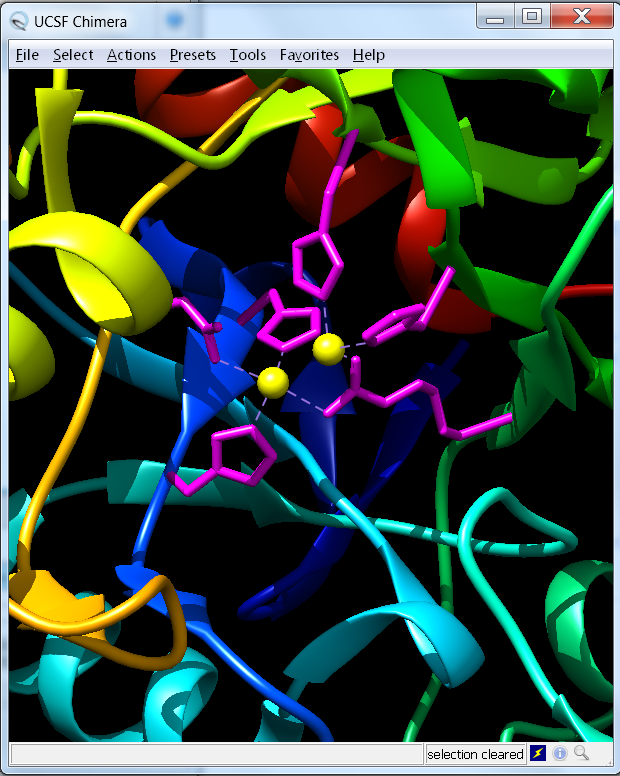 Screenshot showing the catalytic pocket of
1EZ2 (click for a larger view)
Screenshot showing the catalytic pocket of
1EZ2 (click for a larger view)
Because the functional residue information is associated with the Cytoscape node, we need to select the Model, then bring up the popup menu, and select Select→Functional Residues. Note that you will see sections of the ribbon highlighted in green. The Molecular Structure Navigator will also open up to display the selected residues.
Now that the functional residues are selected, we can display their side chains and change the color (we could change their depictions in other ways). Position your mouse in the Molecular Structure Navigator into the blank space to the right of the displayed residues. Now bring up the popup menu. The actions in this menu will apply to all selected residues (or chains, models, etc.). Now, do a Show→All to display the side chains of the functional residues, and then a Color→Atoms/Bonds→magenta to change the color of the side chains so that they will stand out a little.
Chimera's ability to manipulate molecular structures by chemistry is reflected in the features of the Molecular Structure Navigator. To select the ions, we can either use the popup menu of the Model level of the structure to select only the ions of that structure, or the top menu bar Select menu to select all ions. We'll use the Model approach. Bring up the Model popup menu and select Select→Ions. Now, show the ions by bringing up the background popup menu (the one in the blank space to the right of the displayed residues) and do a Show→All to display them, a Color→Atoms/Bonds→yellow and finally, a Depict→Sphere to make them stand out. If you move the structure around in Chimera, you should be able to focus in on the catalytic pocket and get an image similar to the one at the right.
After highlighting the functional residues, we will investigate their interactions with the ligand included in the structure 1EZ2. We will do this by creating a residue interaction network of the ligand and the residues, which are in contact with it.
To select the ligand, we can either use the popup menu of the Model level of the structure to select only the ligand of that structure, or the top menu bar Select menu to select all ligands. We'll use the Model approach. Bring up the Model popup menu and select Select→Ligand. Now, show the ligand by bringing up the background popup menu and do a Show→All to display it and a Color→Atoms/Bonds→orange red to color it. Make sure that the ligand remains selected.
Now that the ligand is selected, we can create the network using the top menu bar Chimera→Residue network generation menu. In the Residue Interaction Network Generation Dialog, enter the name of the network in the Name of new network field, select the option Between selection and other atoms in the drop-down menu Include interactions. To include other interaction types but contacts and hydrogen bonds, check the respective box. Finally, to start the network generation, press on OK. A new network is created and visualized within Cytoscape. The name of the model in the Molecular Structure Navigator is updated to show the association of the model not only with the node but also with the new network.
The default coloring of RIN nodes is based on their secondary structure (blue for sheets and red for helices). To transfer the current residues colors (the rainbow by residue ribbon pattern) to the network nodes, select the model in the Molecular Structure Navigator and use the menu Chimera→Color synchronization. Now, the nodes are colored according to the ribbon color of the residues. If we select all nodes in the RIN view, we can see the corresponding residues in the Chimera window. After that, we can display the residue names by bringing up the background popup menu and do a Label→Residue. Your screen should look similar to the image below.
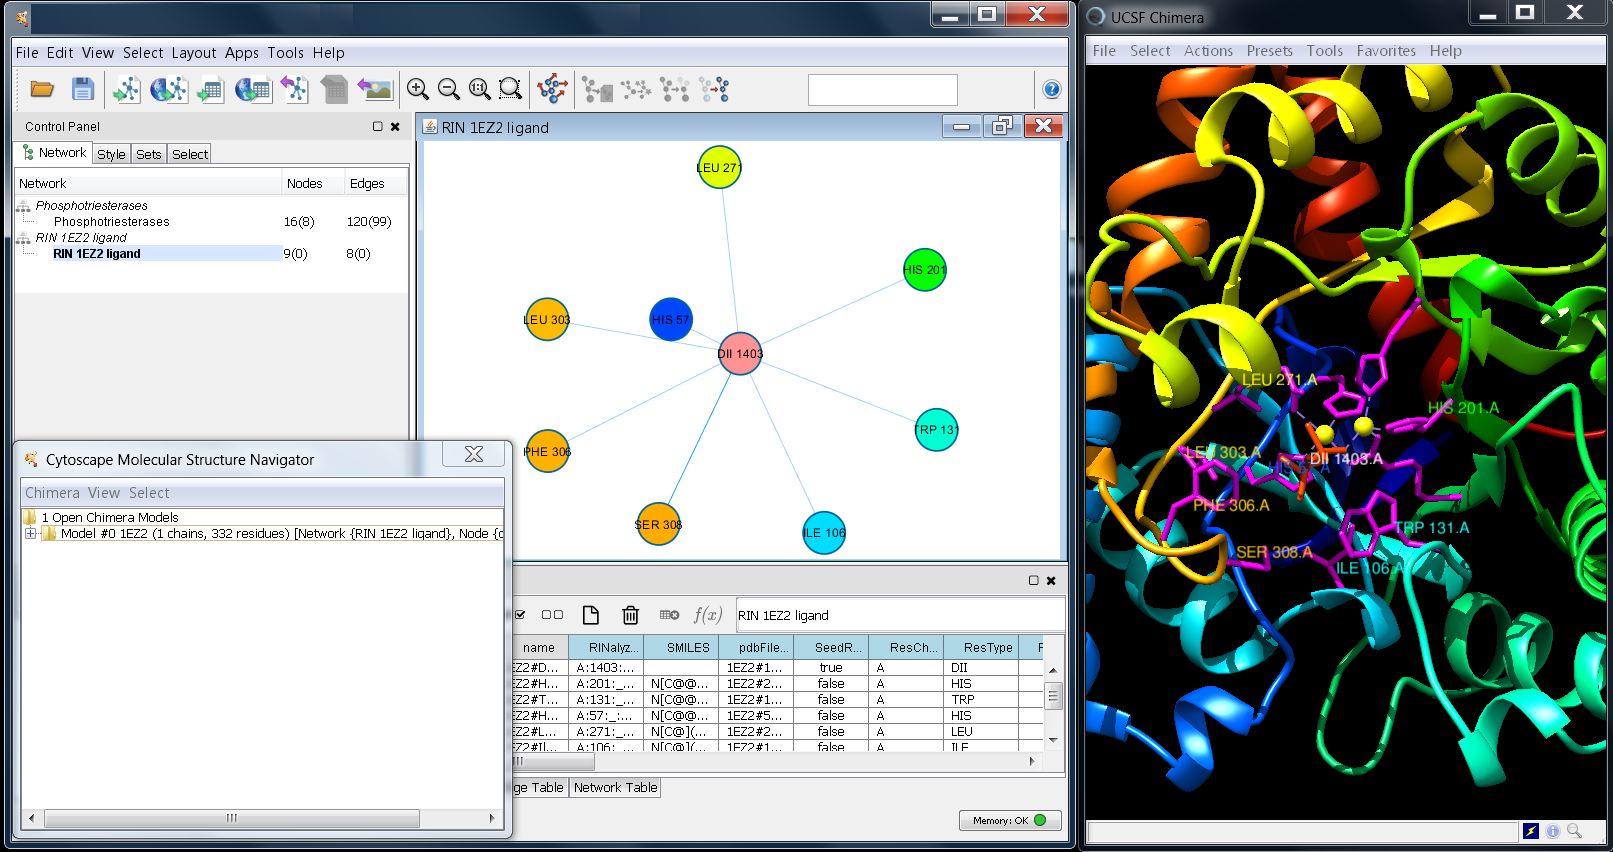 Screenshot showing Cytoscape, the Molecular Structure
Navigator, and UCSF Chimera after creating a network of interactions
between the ligand of 1EZ2 and the residues interacting with it. (click for a larger view)
Screenshot showing Cytoscape, the Molecular Structure
Navigator, and UCSF Chimera after creating a network of interactions
between the ligand of 1EZ2 and the residues interacting with it. (click for a larger view)
Now that we have a nice visualization of 1EZ2, we can load several additional structures to compare the family. We need to go back to Cytoscape to accomplish this. First, make sure that all of the nodes in the Phosphotriesterases newtork are selected by dragging your mouse over the entire network in Cytoscape. Now, we want to load several different structures, including 1QW7, 1PTA, 1PSC, 1HZY, and 1BF6. All of these are solved structures for the phosphotriesterases except, 1BF6, which is a structure for the SFLD subgroup unknown119. To load the selected structures, bring up the context menu and select Apps→structureViz→Open structures for Node(s). Select the structures listed above (using Ctrl-Button 1 on the PC & Linux, apple-Button 1 on the Mac) and initiate the action by pressing OK. If you want, you call also load all structures by just confirming with the OK button. Do this for all of the structures listed above. You call also load all structures by just confirming with the OK button.
Note that as each structure is loaded, a new Node item is added to the Molecular Structure Navigator. The outline color of the Node represents the default color of the Chimera model. This should allow you to quickly find each of the structures.
We now want to go through some of the steps we did for the 1EZ2 structure for each of the new structures that we loaded. In particular, we want to delete the extra chains and simplify Chain A of each structure to only show the backbone. For each of the structures:
When you have completed simplifying all of the new structures, you should have a display that looks similar to the one below.
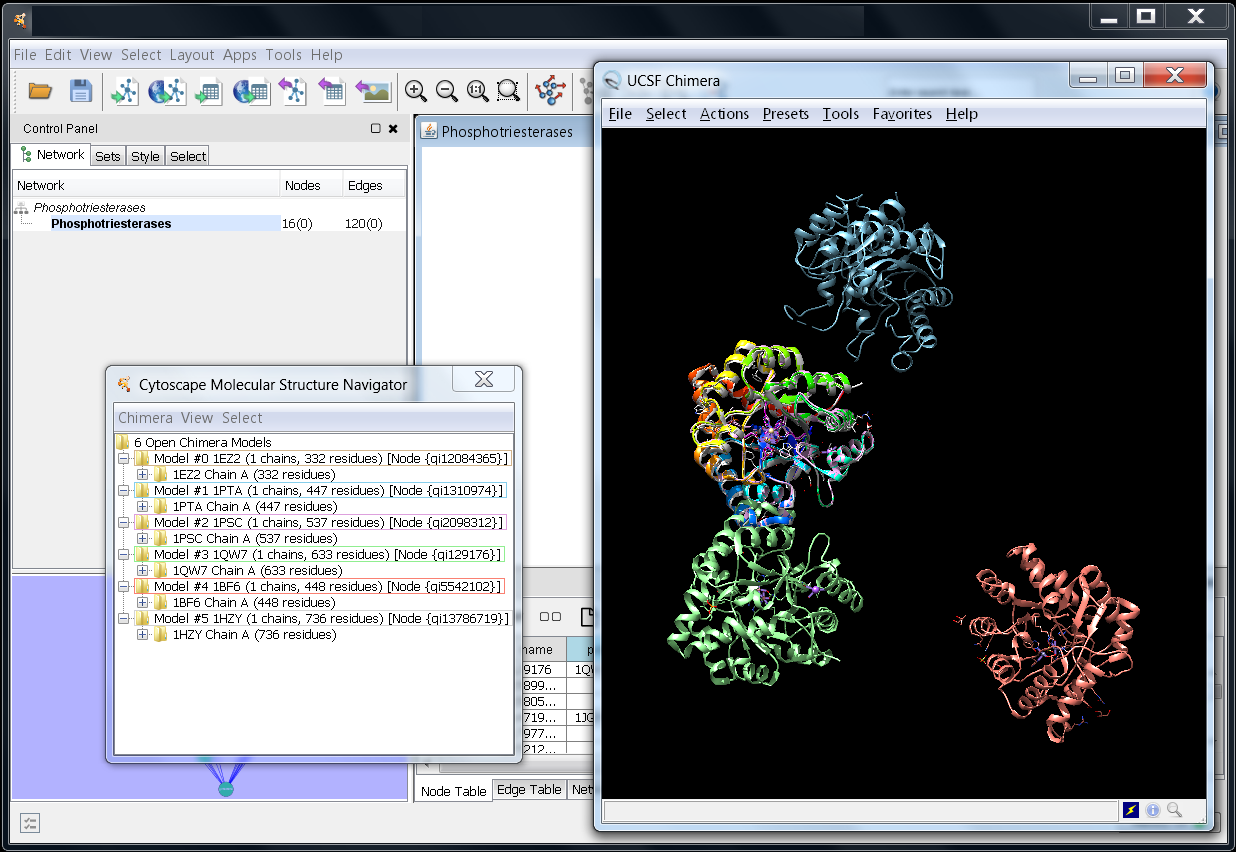 Screenshot showing the Molecular Structure Navigator and the
Chimera window after loading all of the additional structures
(click for a larger view)
Screenshot showing the Molecular Structure Navigator and the
Chimera window after loading all of the additional structures
(click for a larger view)
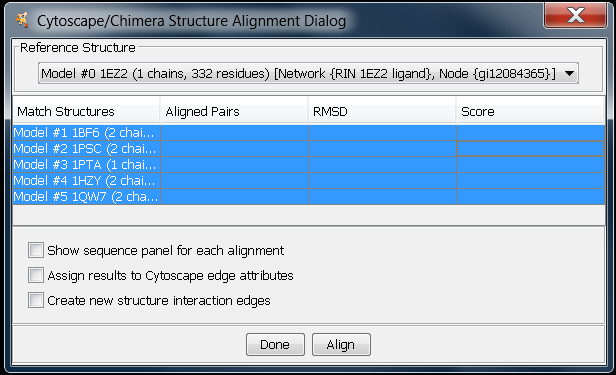 The Cytoscape/Chimera Structure Alignment Dialog
(click for a larger view)
The Cytoscape/Chimera Structure Alignment Dialog
(click for a larger view)
Our final step is to align all of these structures using Chimera's Sequence/Structure tools6. Some important notes about this procedure. First, this is a pairwise alignment method, so we're going to align each structure to 1EZ2. As a result, care must be taken when interpreting the results, just as when viewing the results from pairwise blast values. Second, the alignment reports three values: RMSD, Aligned Pairs, and Score. The alignment score provides a rough indication of similarity in sequence and secondary structure. Unfortunately, there is currently no agreed-upon metric for structural alignment beyond RMSD, which might be misleading when differing numbers of residues are used for the alignment.
To align the structures, we will use the Chimera menu of the Molecular Structure Navigator: Chimera→Align structures→by model. This will bring up the Cytoscape/Chimera Structure Alignment Dialog. Because we are doing pairwise alignments, we need to select a reference structure, then select all of the structures we want to match (Match Structures). Select 1EZ2 as our Reference Structure, and then select all of the other loaded structures as Match Structures. You have the option of displaying the sequence panel for each alignment to see which residues were actually aligned, and to create new edges in Cytoscape to assign the alignment values (RMS, Aligned pairs, and Score) to the edge attributes. To perform the alignment, click on Align. The results of the alignment are shown below. The rows in the dialog have been sorted by clicking on the Score column to sort from smallest to largest score. As can be seen, the structures for 1BF6 is by far the poorest alignment partner to 1EZ2. Of course, a more complete analysis would include aligning all structures to each other to determine if these two pairs are particularly disparate, or if this does indicate a pattern between 1BF6 and the other phosphotriesterase structures.
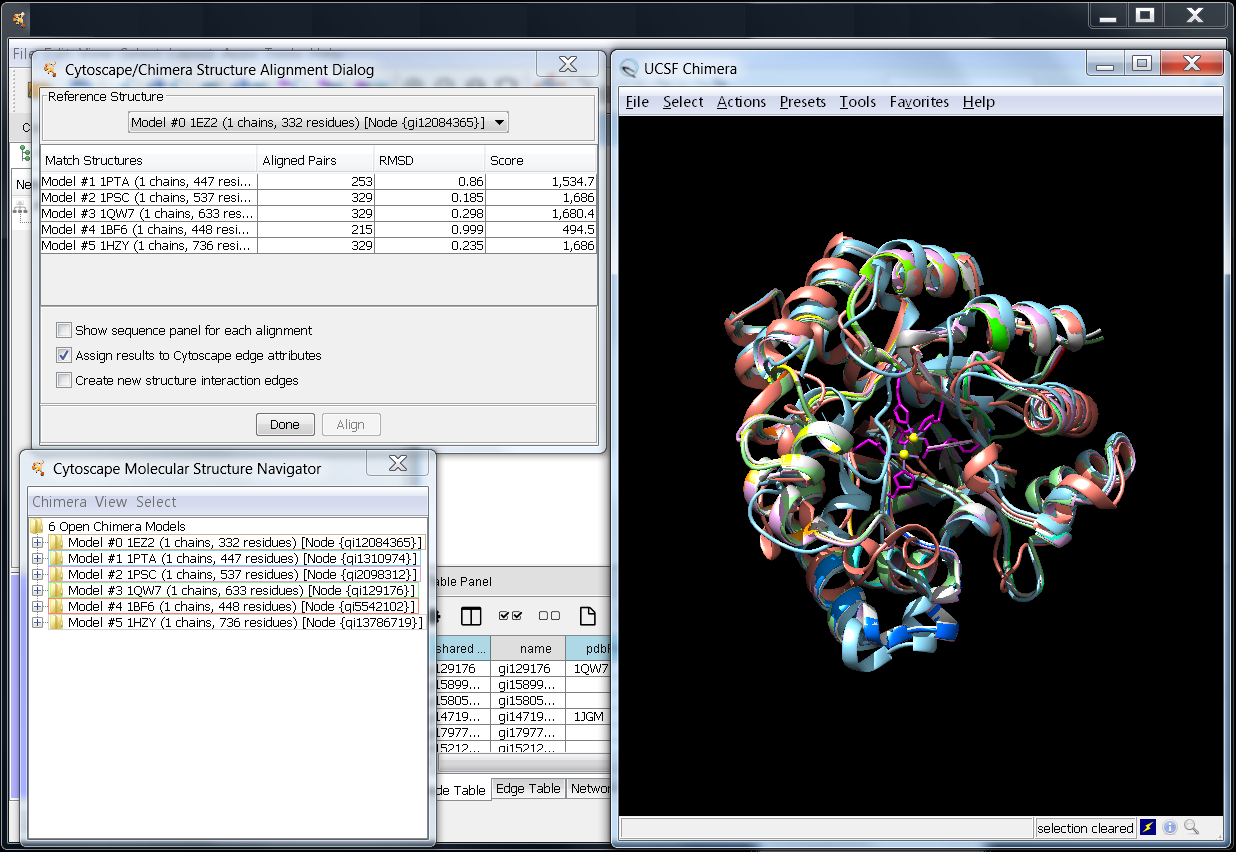 The Cytoscape/Chimera Structure Alignment Dialog showing
the results of aligning 1EZ2 to 1BF6, 1PTA, 1QW7, 1PSC,
and 1HZY. The rows have been sorted by Score from
smallest to largest.
(click for a larger view)
The Cytoscape/Chimera Structure Alignment Dialog showing
the results of aligning 1EZ2 to 1BF6, 1PTA, 1QW7, 1PSC,
and 1HZY. The rows have been sorted by Score from
smallest to largest.
(click for a larger view)
structureViz2 will operate on any Cytoscape network that has the necessary node attributes. The table below shows the attributes used by structureViz2 and their uses.
| Attribute | Alternatives | Format | Use | |
| pdbFileName | Structure, pdb | Comma-separated list | Names of pdb structures associated with the Node. There must be at least one structure to load into Chimera | |
| FunctionalResidues | . | Comma-separated list of residue specifiers (e.g. His234, Lys238) | Used to provide functional residue information for selection in Chimera | |
| Sequence | . | Protein sequence as single-letter amino acids | For use in a future version of structureViz which will include sequence comparison capabilities |
If you wish to explore the capabilities of Cytoscape and structureViz2 more, you can download the data for the entire amidohydrolase superfamily in the SFLD. This contains 959 sequences and approximately 50,000 edges. There are also references to about 100 PDB structures of amidohydrolase proteins. To see more information about the amidohydrolase superfamily, see the amidohydrolase superfamily page in the SFLD.
2Buchbinder JL, Stephenson RC, Dresser MJ, Pitera JW, Scanlan TS, Fletterick RJ. Biochemical characterization and crystallographic structure of an Escherichia coli protein from the phosphotriesterase gene family. Biochemistry, 1998 37(15). [PMID: 9548740]
3Pettersen, E.F., Goddard, T.D., Huang, C.C., Couch, G.S., Greenblatt, D.M., Meng, E.C., and Ferrin, T.E. UCSF Chimera - A Visualization System for Exploratory Research and Analysis. J. Comput. Chem., 2004 25(13). [PMID: 15264254]
4Shannon P, Markiel A, Ozier O, Baliga NS, Wang JT, Ramage D, Amin N, Schwikowski B, Ideker T. Cytoscape: a software environment for integrated models of biomolecular interaction networks. Genome Res., 2003 13(11). [PMID: 14597658]
5Pegg SC, Babbitt PC. Shotgun: getting more from sequence similarity searches. Bioinformatics, 1999 15(9). [PMID: 10498773]
6Meng EC, Pettersen EF, Couch GS, Huang CC, Ferrin TE. Tools for integrated sequence-structure analysis with UCSF Chimera. BMC Bioinformatics, 2006 12(7). [PMID: 16836757]
Laboratory Overview | Research | Outreach & Training | Available Resources | Visitors Center | Search