Tom Goddard
April 24, 2024
| Note: The experimental diffplot command described here has been superceded by the similarstructures command and graphical user interface. The diffplot approach of loading hundreds of atomic models and using hundreds of aligned sequences was too slow. The similar structures tools are much faster. |
Here is how to cluster tens or hundreds of protein structures according to differences in backbone conformation using ChimeraX. This uses a new ChimeraX command diffplot available in ChimeraX daily builds dated April 24, 2024 and newer. The method looks at the x,y,z coordinates of some chosen residues for each of the structures and projects all those x,y,z values treated as a single high dimensional vector down to two dimensions using the UMAP (uniform manifold approximation and projection) algorithm.
We will cluster 200 structures of the human serine/threonine-protein kinase B-raf (UniProt BRAF_HUMAN) that is involved in the transduction of mitogenic signals from the cell membrane to the nucleus.
We will use a B-Raf kinase structure PDB 4xv9 to search for other PDB B-Raf structures with very similar sequences using BLAST sequence search and an e-value cutoff of 1e-100. This finds structures with sequences that are at least 90% identical.
Open reference structure PDB 4xv9 with ChimeraX command
open 4xv9
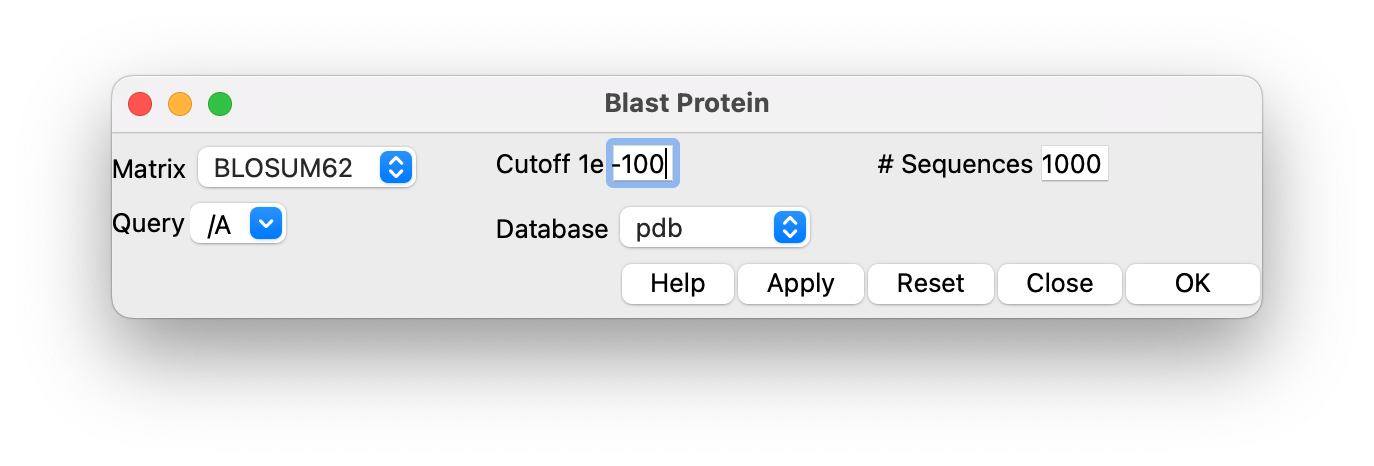
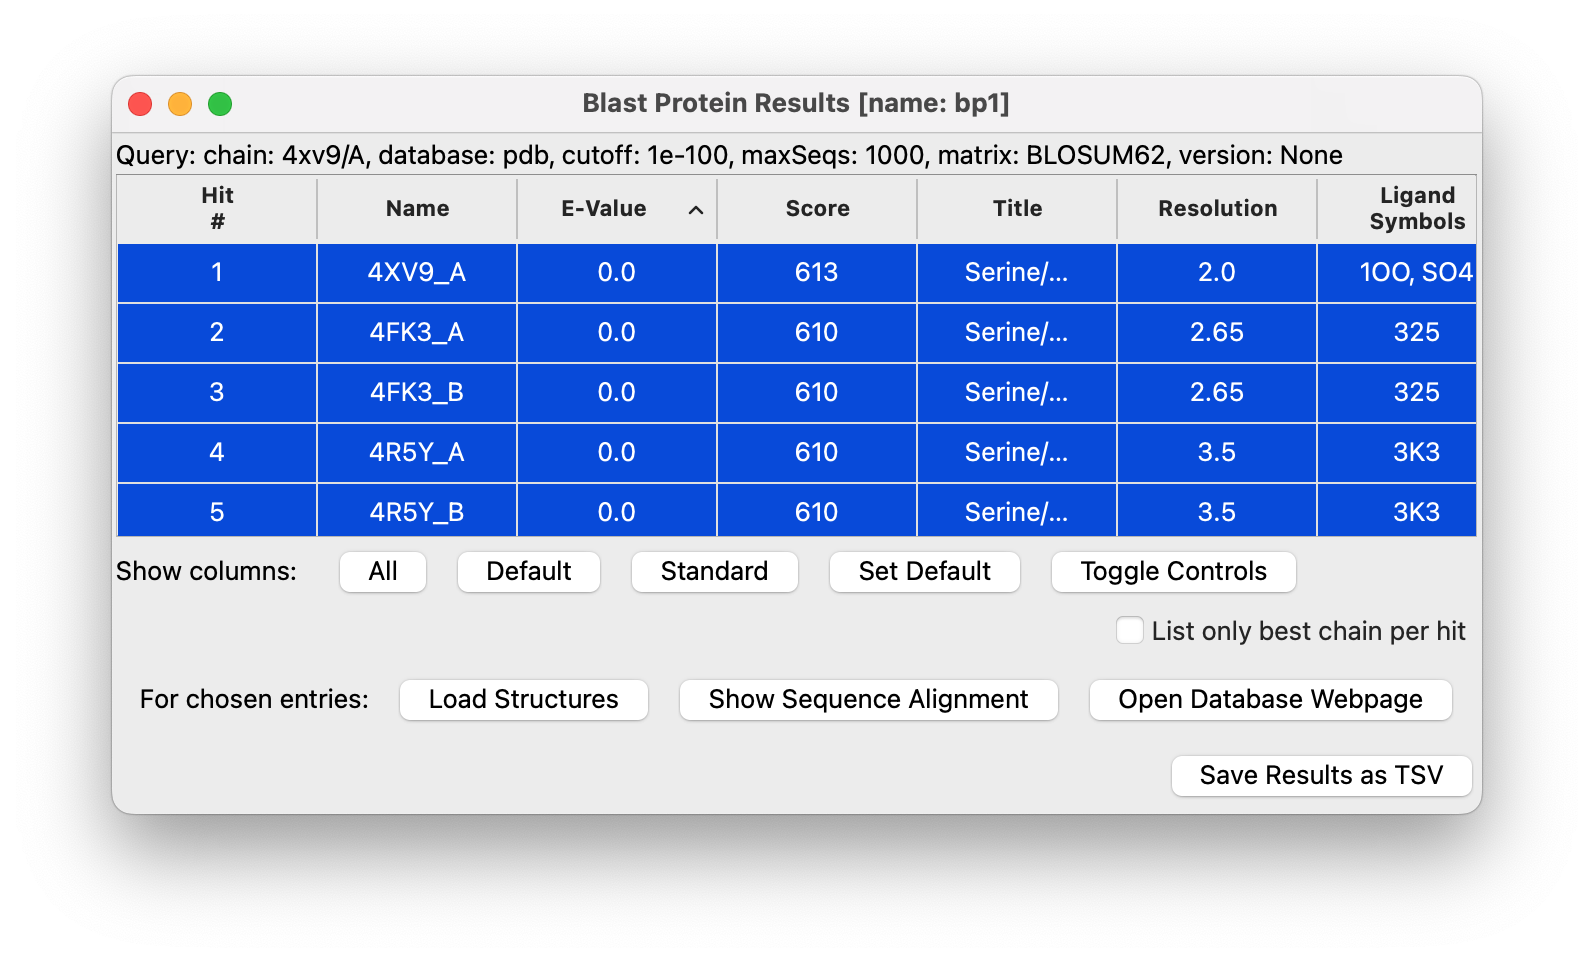
Use ChimeraX menu Tools / Sequence / Blast Protein and set the e-value cutoff to 1e-100 in the panel and the maximum sequences to 1000 and press Ok. In about 10 seconds a new panel showing 211 matching PDB chains appears. Select all the table entries by clicking on the first line, then shift click on the last table entry (#211), then press the Load Structures button. This will take several minutes as it fetches the 211 structures from the Protein Databank.
|
|
|
|
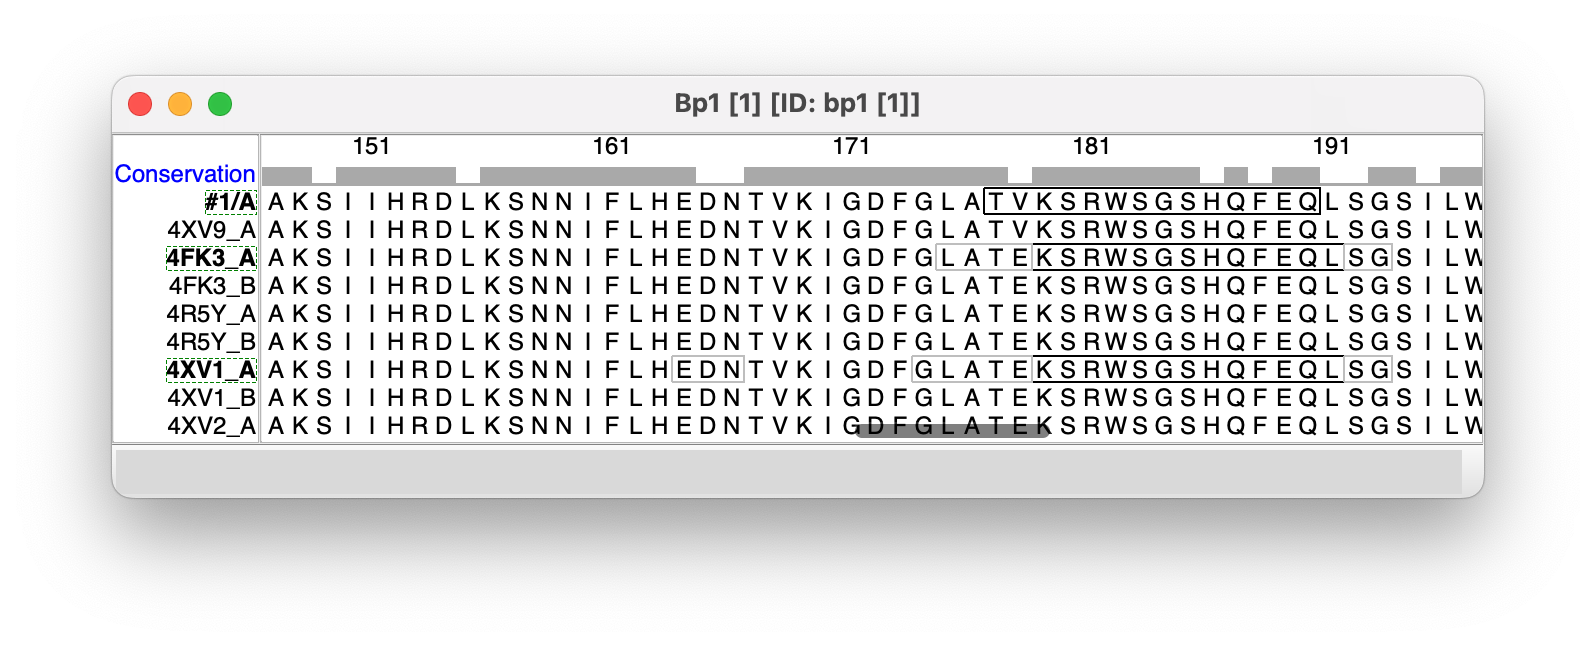
Next press the Show Sequence Alignment button on the Blast Protein Results panel. It will take about a minute to show the 211 aligned sequences. The sequence alignment will be needed to know the matching residues in the 211 structures since the residue numbering of some structures may be different. You can now close the Blast Protein Results panel using its title-bar button.
Instead of using the Blast user interface panel to find the structures and load structures and sequence alignment you can use this equivalent ChimeraX blastprotein command.
blastprotein /A cutoff 1e-100 maxSeqs 1000 loadStructures true showSequenceAlignment true name BRaf showResults false
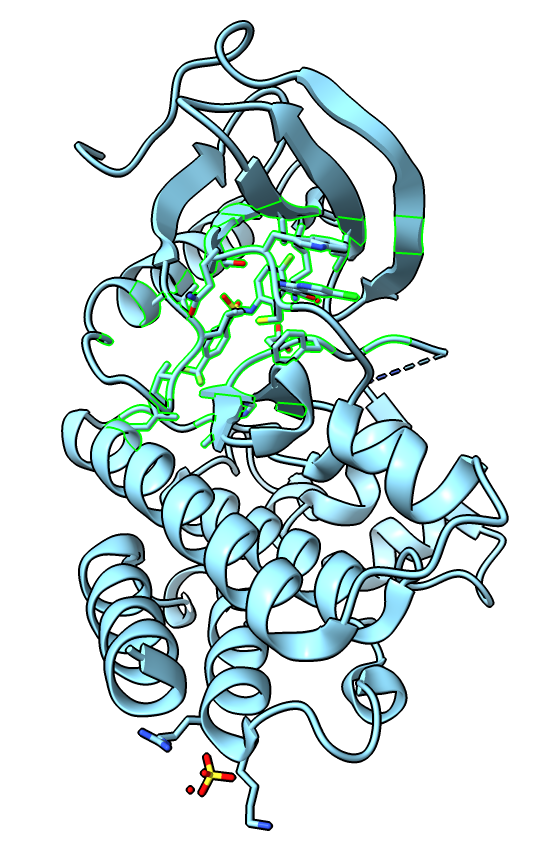
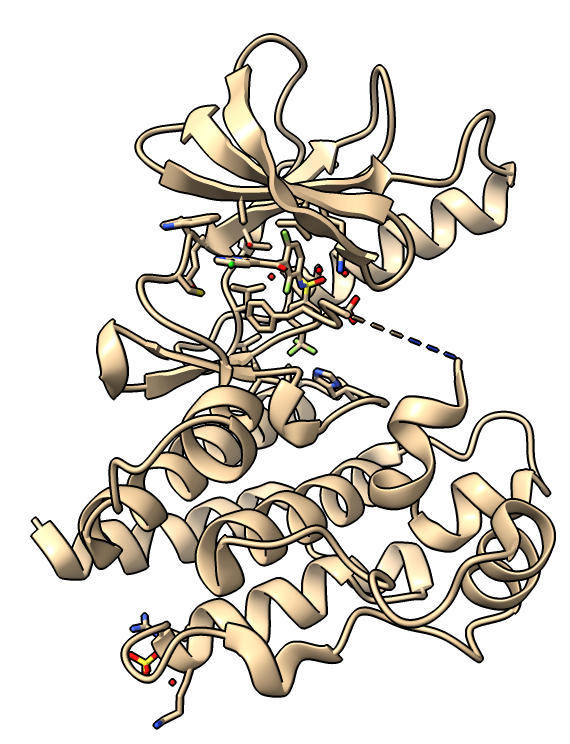
We will cluster the structures using the C-alpha atom positions for residues near the bound ligand in our reference structure 4xv9.
Undisplay the 211 similar structures, then select the 4xv9 ligand (hovering the mouse over it shows it is residue number 801) and all protein residues within 5 Angstroms using with ChimeraX commands. Select the residues on structure #2 (not structure #1) because the clustering only works on structures whose names match those in the sequence alignment.
      hide #1,3-212 models
      select #2:801 :<5 & #2 & protein
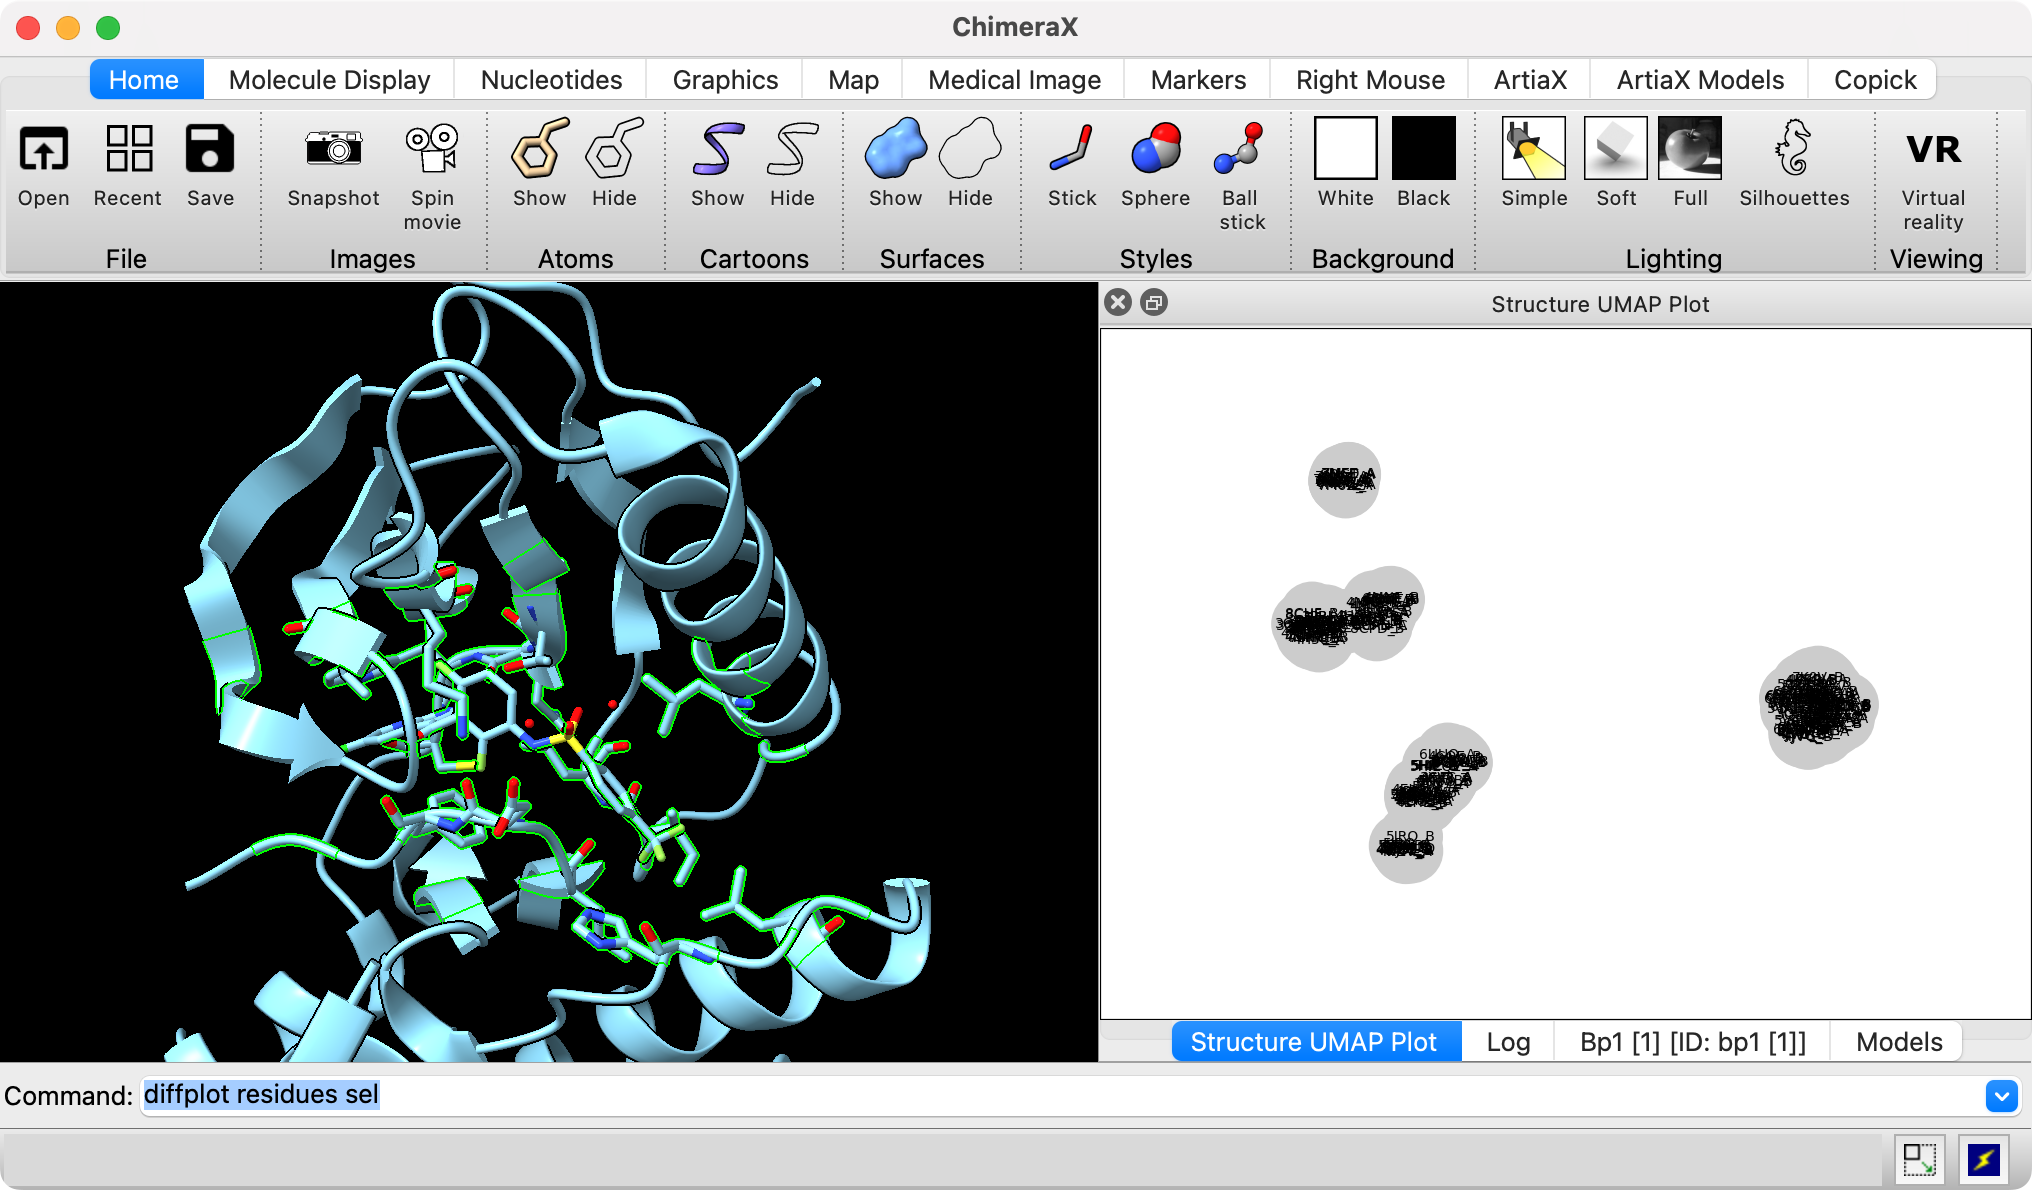
To cluster the structures using a UMAP projection of the vector of C-alpha atom coordinates for these selected residues for each structure use the ChimeraX command
diffplot residues sel
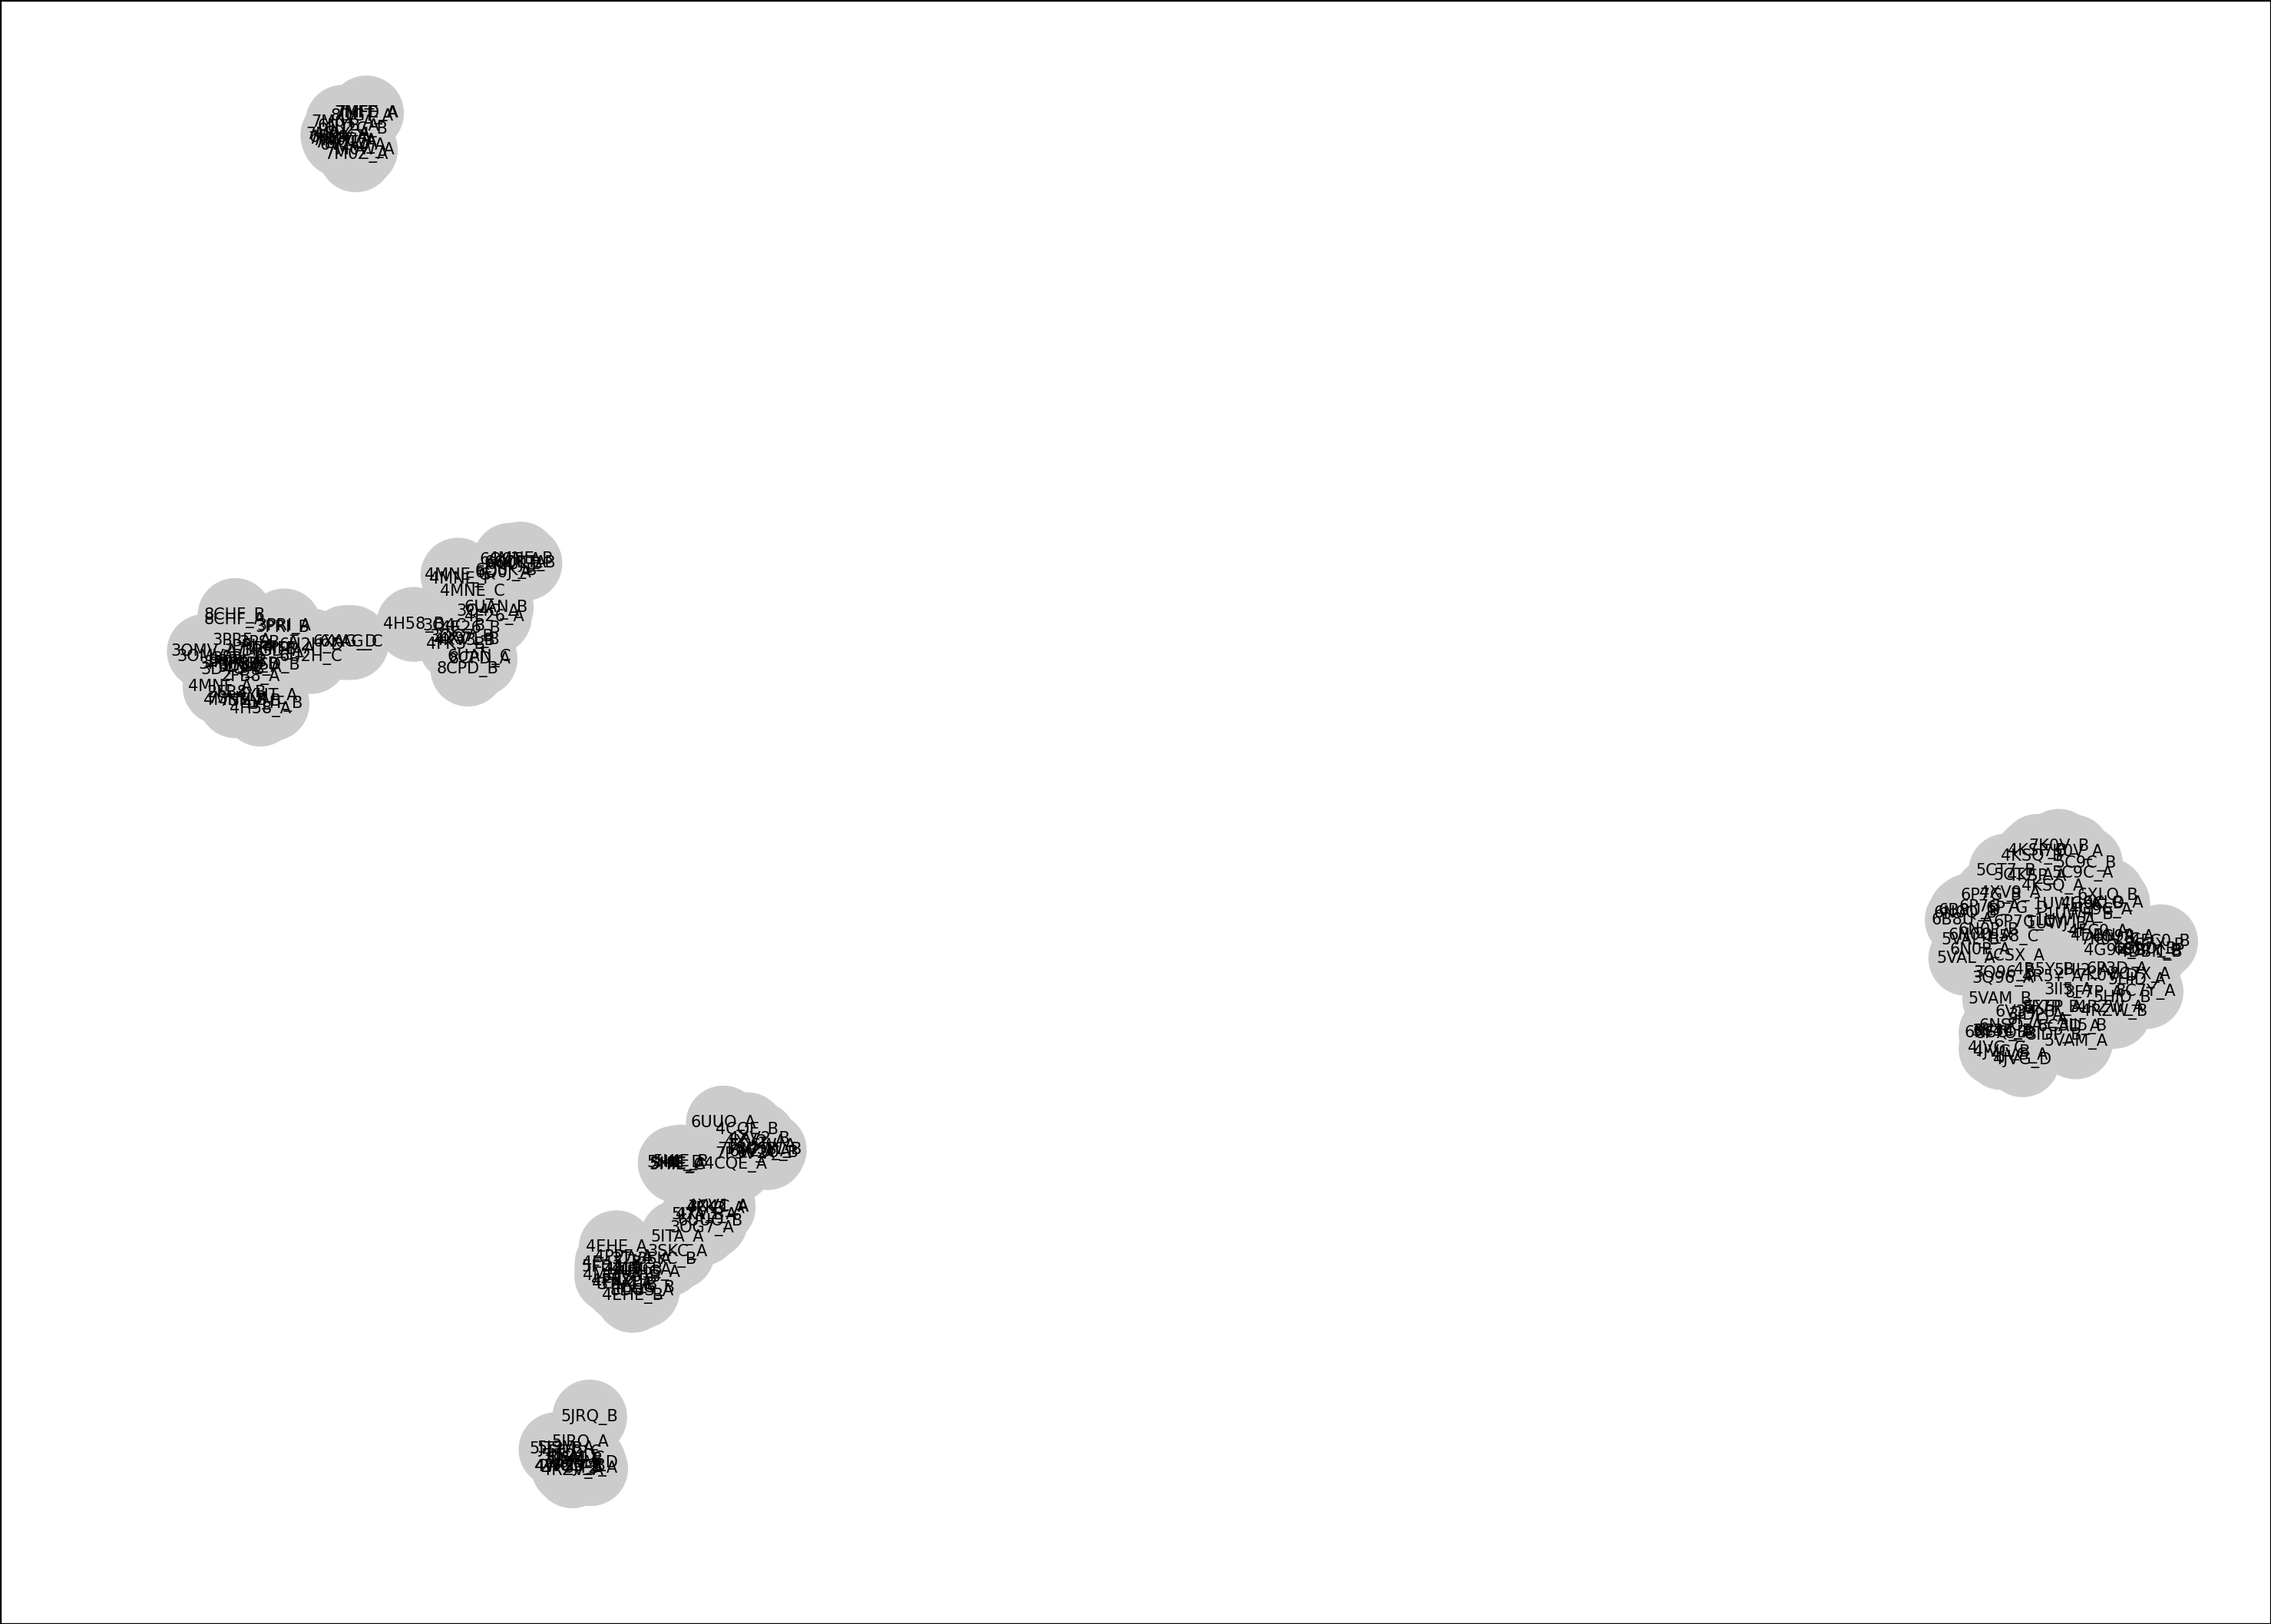
A plot is shown with 172 gray circles with PDB and chain names for each, but the text is not readable because they are overlapped. Scroll in the plot to zoom, and use middle mouse button or Alt-drag to translate. To allow the plot to be bigger you can drag it using its title-bar out of the main ChimeraX window, or drop it on top of the log panel. I find it useful to stack the Log, Models, Sequence Alignment and Plot windows on top of each other.
The Log panel says only 172 of the 211 structures were compared because 39 structures do not have all 24 of the chosen residues (ie. they have gaps in the alignment or missing atomic coordinates). To see which structures are missing which residues use command
diffplot residues sel verbose true
In the log it lists many structures that are not aligned in column 175 of the sequence alignment which is residue 597 in our selected residues. So lets remove residue 597 from the selection so that we can include those structures in the comparison.
      select subtract #2:597
      diffplot residues sel
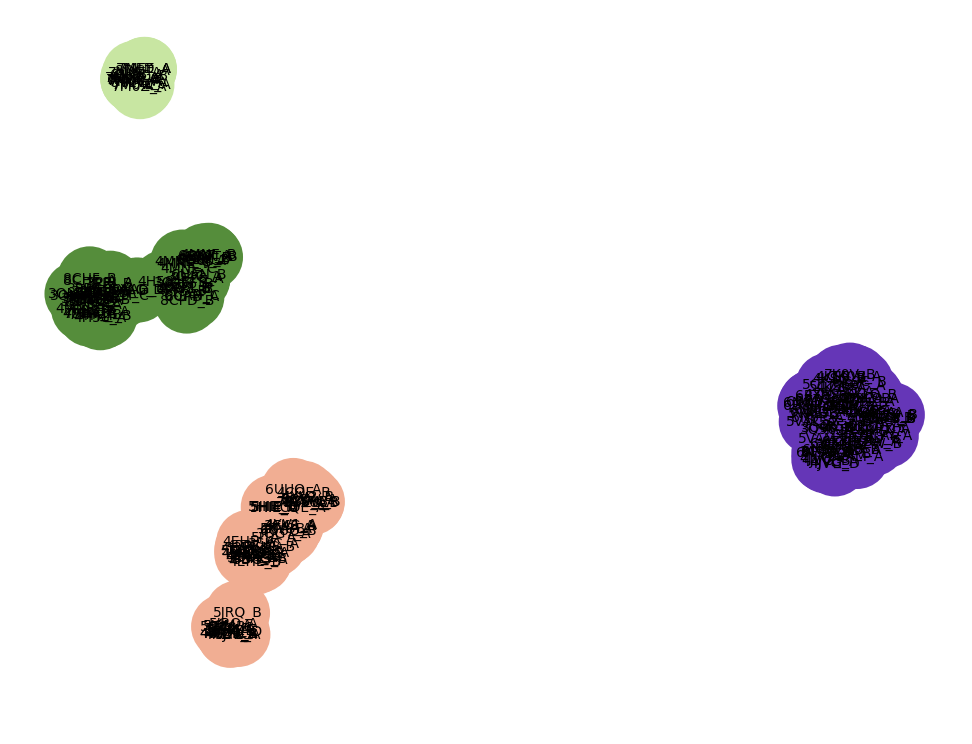
It looks like there are 4 gray clusters of structures in the plot. We can group them using k-means and color each group a different color
diffplot residues sel cluster 4
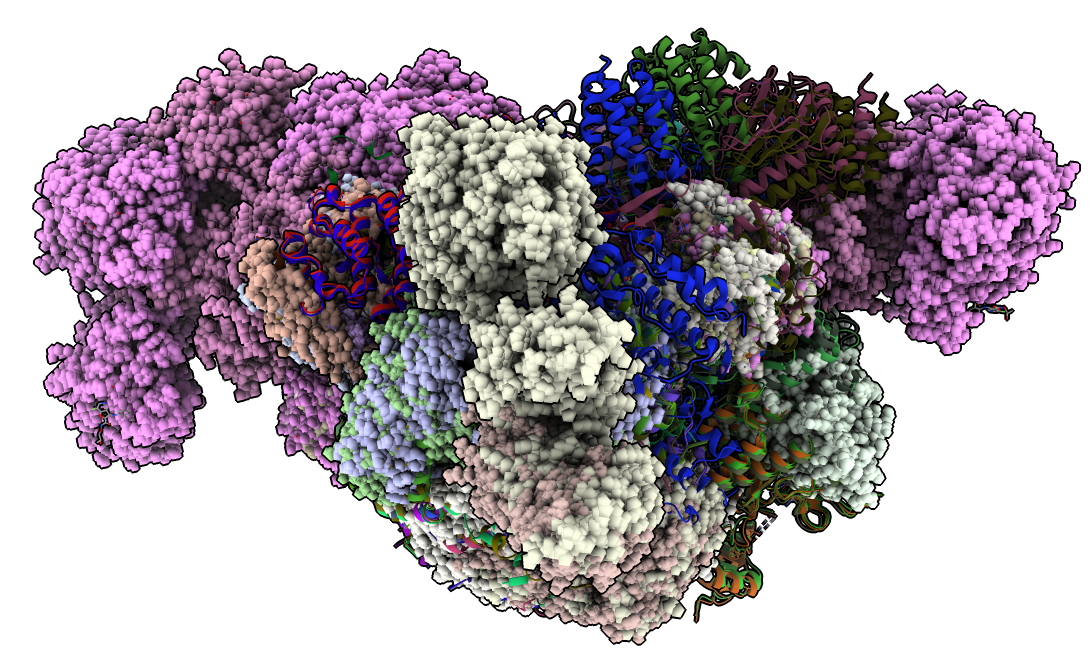
To show all structures click on the white background in the plot and choose "Show all structures" from the menu. To hide atoms (except for #2 which has the ligand and selected residues) and show all structures as ribbons use
      hide #3-212 atoms
      show ribbons
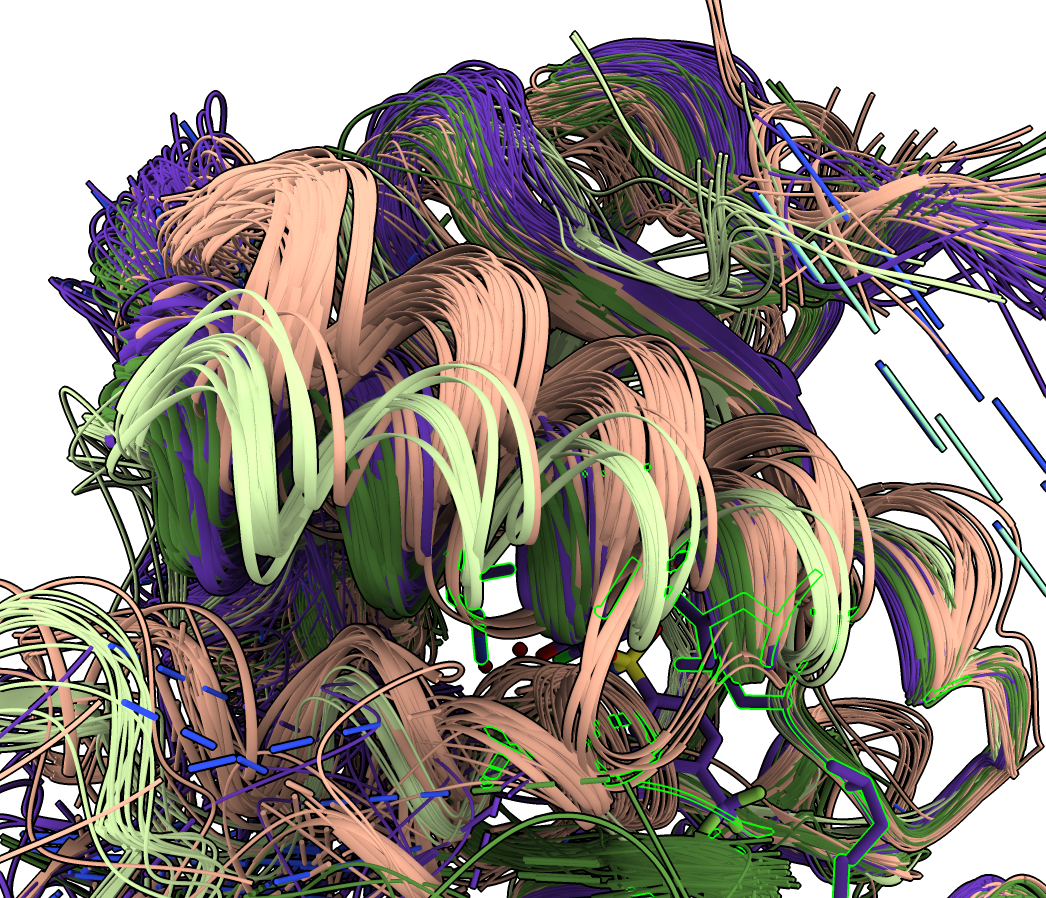
Many of the structures are complexes of multiple proteins. To hide all the extra chains that are not aligned to 4xv9 chain A click the plot background and choose "Hide extra chains" from the menu.
With 202 structures shown as ribbons it is easier to see the different backbone paths if the ribbons are made very thin. To do this click the plot background and choose "Thin ribbons" from the menu. Also the soft lighting (toolbar icon or command "light soft") makes it easier to see the differences.
Note that in some places the colored ribbons follow separate paths. An important activation helix takes different paths in pink, light green and dark green clusters. The different colored ribbons also take different paths in other parts of the protein.
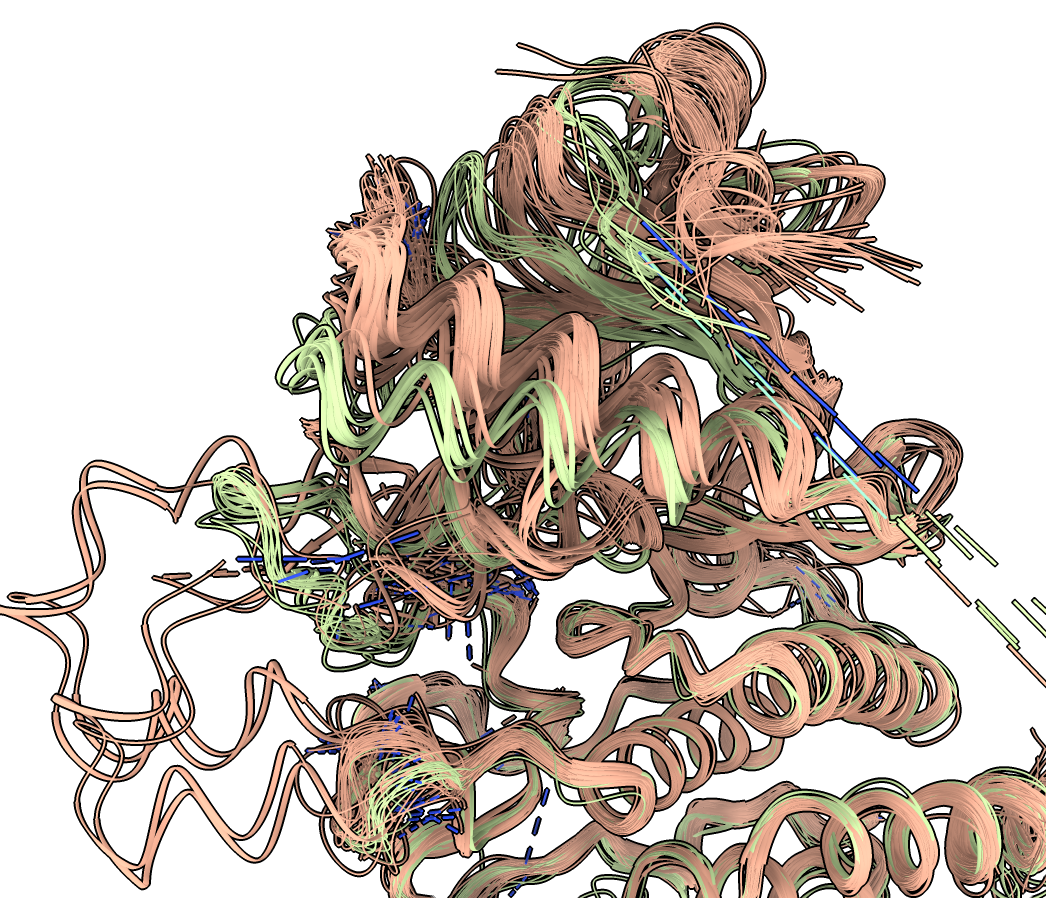
To get a better look at how two clusters differ we can hide the other clusters. Click on the colored region of the plot and choose menu entry "Hide cluster". For instance we can hide the dark green and purple clusters leaving a clearer view of the pink and light green structures.
| 
|
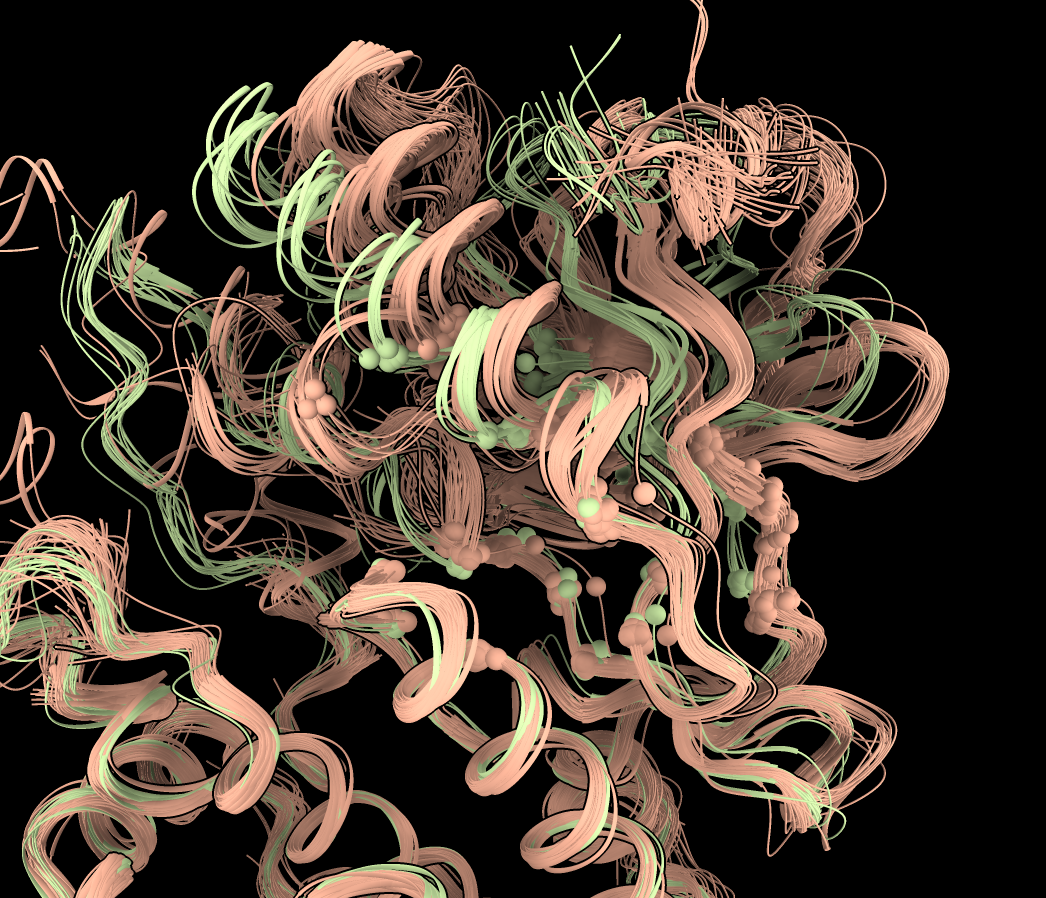
The clustering was done just at 23 selected C-alpha atoms. To see clearly which atoms were used click the plot background and choose menu entry "Show comparison atoms". To make them smaller choose "Select comparison atoms" then in the Molecule Display toolbar click "Ball stick" style and then ctrl click the graphics background to clear the selection. You can also make the ribbons transparent to more easily see the comparison atoms using command
transparency 50 ribbon
There are many directions look into to help visualize differences in large numbers of related structures. These ideas are not in priority order.