UCSF ChimeraX
UCSF ChimeraX (or simply ChimeraX)
is the next-generation molecular visualization program from the
Resource for Biocomputing,
Visualization, and Informatics (RBVI),
following UCSF Chimera.
ChimeraX can be downloaded free of charge
for academic, government, nonprofit, and personal use.
Commercial users, please see
ChimeraX commercial licensing.
ChimeraX is developed with support from National Institutes of Health R01-GM129325.
 ChimeraX on Bluesky:
@chimerax.ucsf.edu
ChimeraX on Bluesky:
@chimerax.ucsf.edu
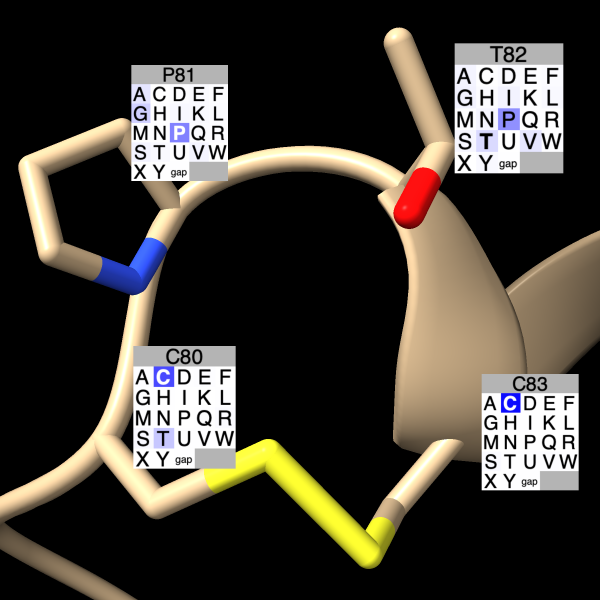
Residues can be labeled with color-coded grids showing conservation in
an associated
Profile Grid
multiple sequence alignment.
The image shows conservation within a disulfide-bonded loop
(chain B residues 80-83) of PDB
2B1L
based on a redoxin-superfamily sequence alignment.
Conservation grid labels can be shown using the
Profile
Grid context menu or the
sequence
grid label command in ChimeraX v1.12 from May 2026 and newer.
More features...
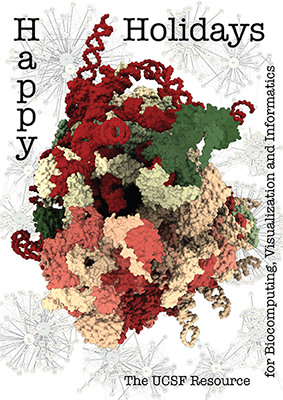
The architecture of the human ribosome has been determined at
near-atomic resolution by electron microscopy (Anger et al.,
Nature 497:80 (2013)).
The structure, comprising 82 proteins and five RNA molecules, is
shown with shadows cast from all directions to accentuate depth.
In the background are schematic representations of contacts
between the component molecules.
See the image setup script
card.cxc
using the
'Tis the Season color palette (credit to MrsP).
See also the RBVI
holiday card gallery.
More images...