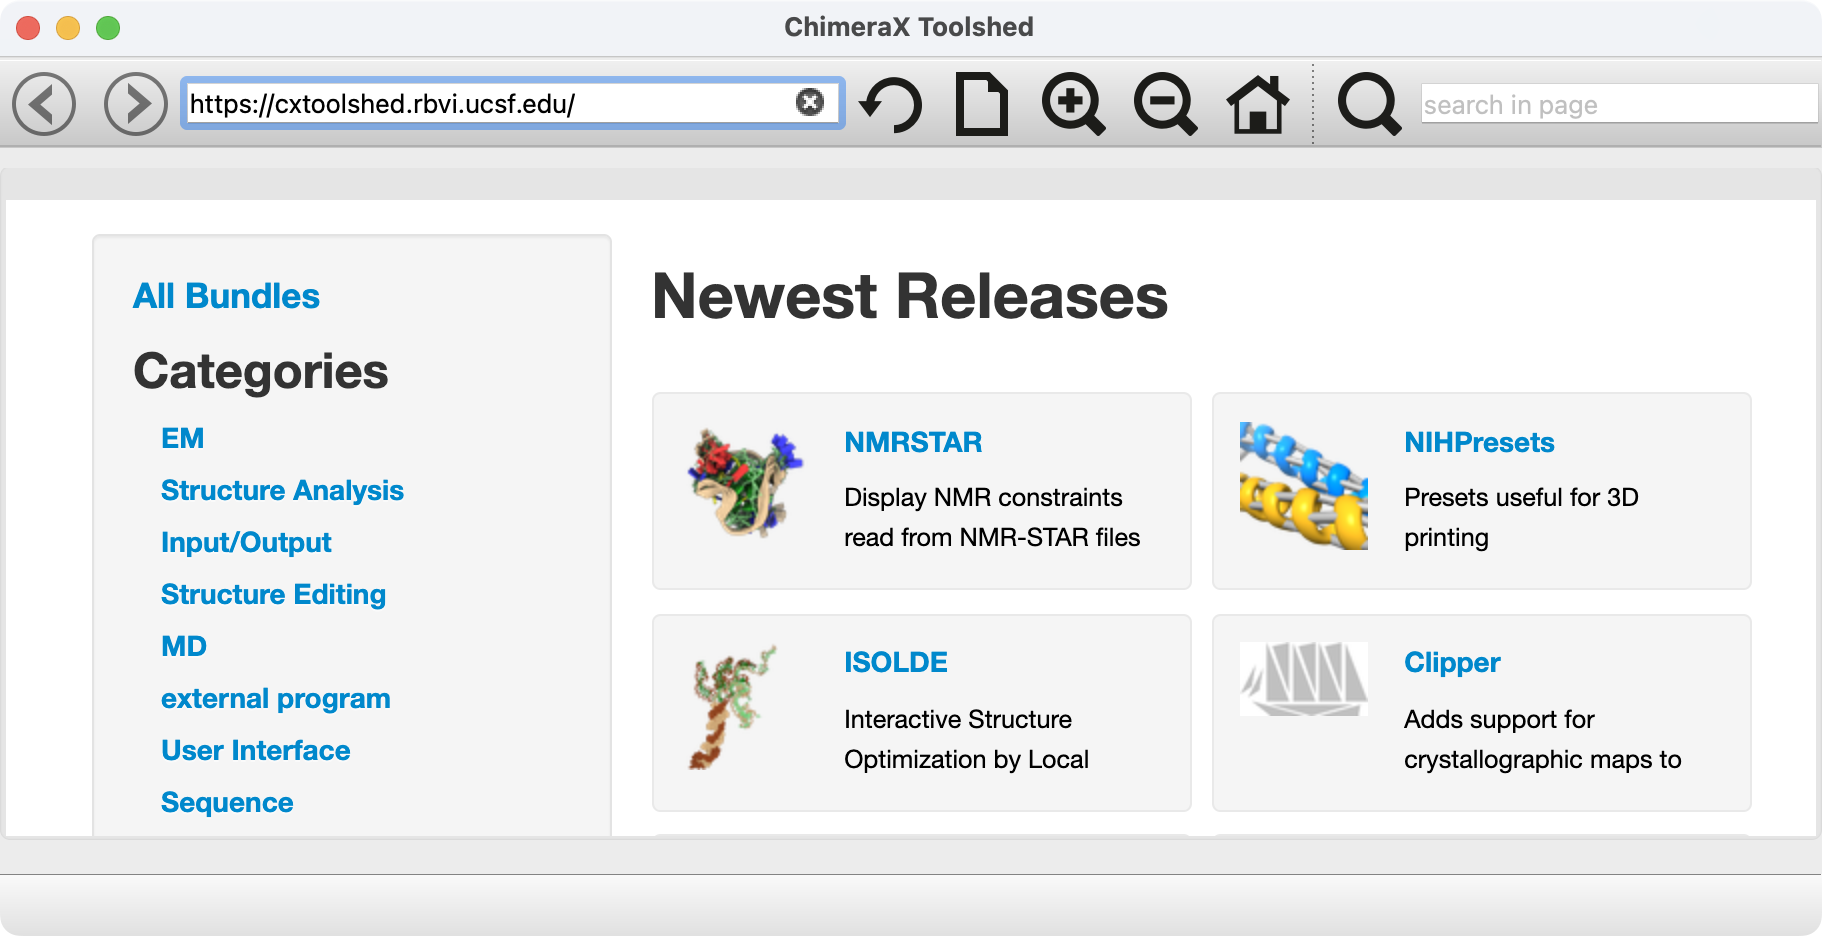
This is an introduction to visualizing atomic models, X-ray maps, cryoEM maps, AlphaFold models and NMR constraints using ChimeraX 1.7. If this tutorial is opened within ChimeraX (menu Help / Tutorials), then the command links can be clicked to run the commands.
Exploring atomic models: SARS-CoV-2 main protease with paxlovid
Basic coloring and styles
- Open SARS-CoV-2 main protease with paxlovid bound.
open 7rfw
- Try Mac trackpad 2,3,4-finger drag for rotation, translation, zoom.
- Try different styles, all atom, sphere, stick, surface.
- Show Presets / Original Look.
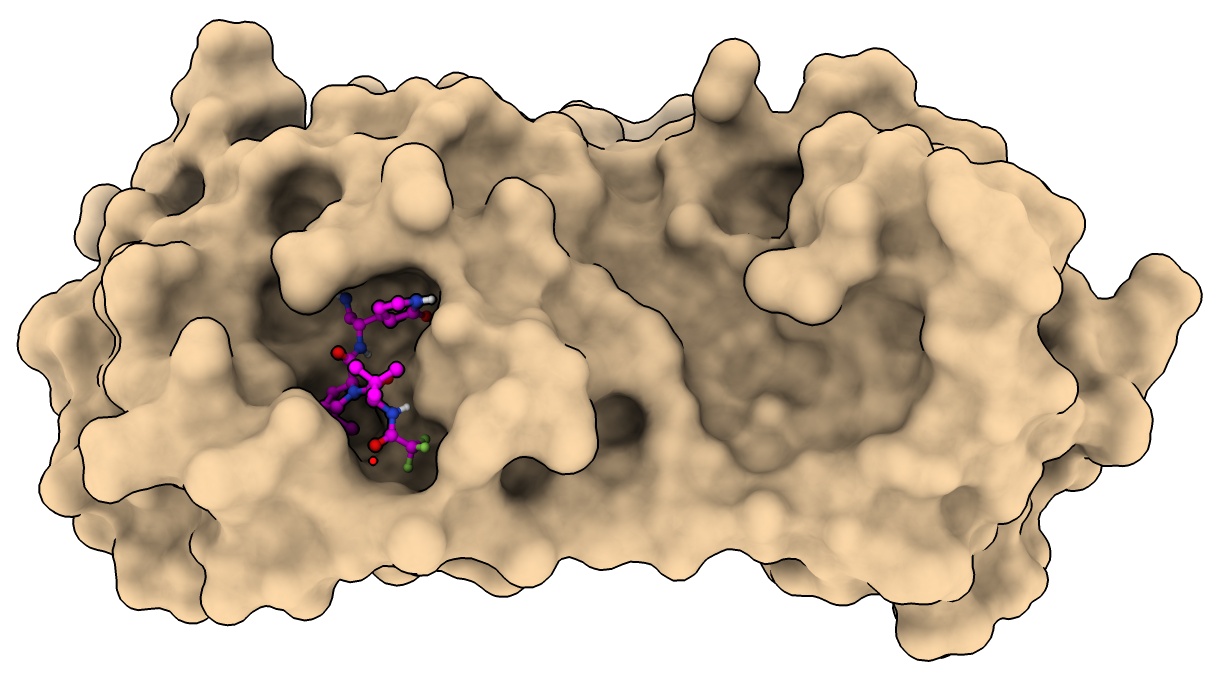
- Color nirmatrelvir menu Select / Structure / ligand and Actions / Color / magenta, by heteroatom
select ligand
color sel magenta ; color sel byhet
- Note covalent linkage. Hover to identify residue CYS 145.
- Show surface: clear selection, Molecule Display toolbar Surface / show.
surface
- Home toolbar soft lighting.
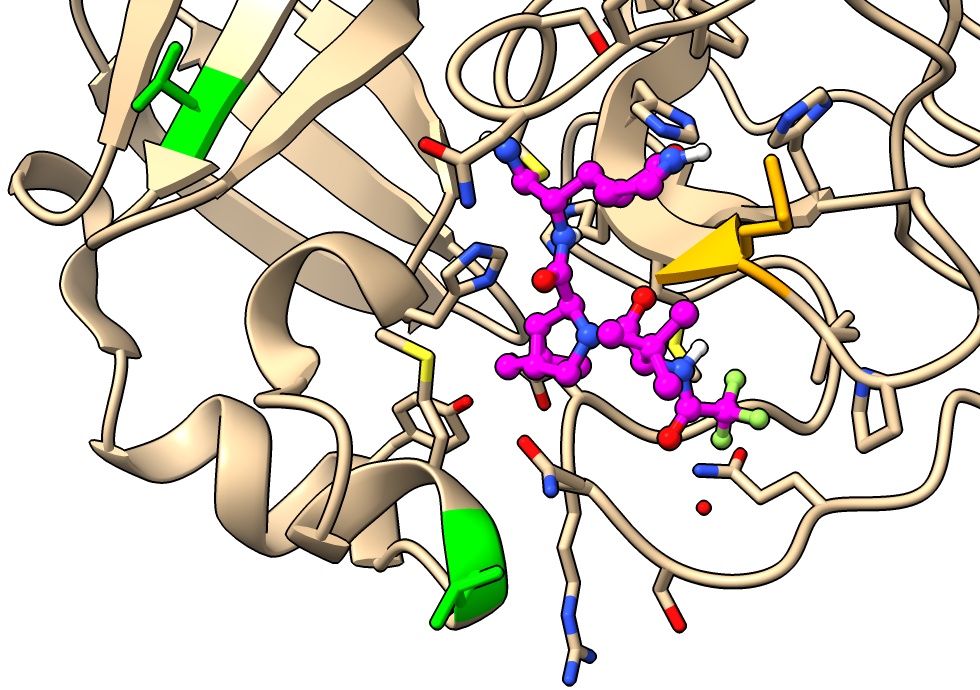
Drug resistance mutations
Mutation E166V reduces nirmatrelvir binding 100-fold, but also greatly reduces viral fitness.
Compensatory mutation T21I or L50F restore fitness while still disabling drug binding.
- Close surface
surface close
- Color mutation residues.
color :166 orange
color :21,50 lime
- Hard to see how compensatory mutations restore fitness.
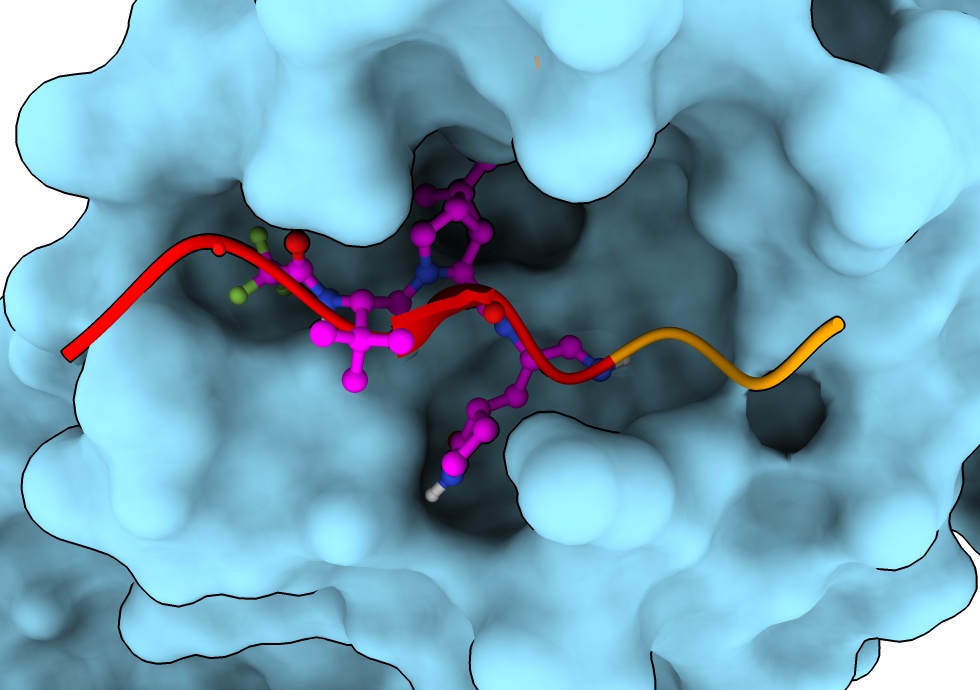
Look at native peptide binding
Compare to SARS-CoV-2 main protease with 9 amino acid native nsp5/6 peptide bound.
- Open 7dvw
open 7dvw
- Align structures, menu Tools / Structure Analysis / Match Maker
matchmaker #2 to #1
- Color peptide. Click chain C in table in Log to select then menu Actions / Color / orange.
color #2/C orange
- Color to show cleavage site, between peptide residue 6 and 7.
color #2/C:1-6 red
- Note cleavage site is near covalent linkage of paxlovid.
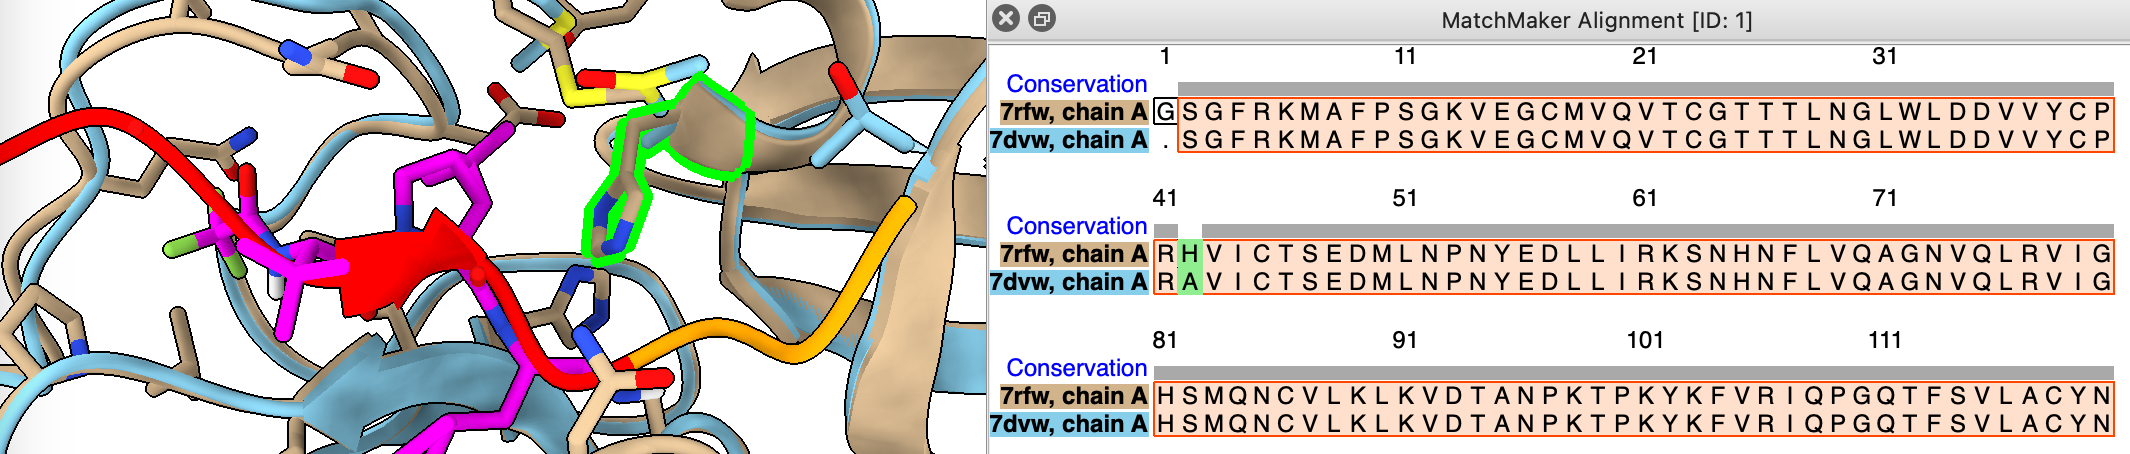
Are the sequences of 7rfw and 7dvw the same?
- Use match maker dialog and turn on show alignment option
mm #2 to #1 show true
- Add consevation header by ctrl-click on sequence, headers / conservation.
sequence header conservation show
- Note H41A is a difference, select it on sequence to see location on structure.
Mutation H41A prevents cleavage allowing to solve structure with uncleaved peptide bound.
select #2:41
X-ray structures and maps
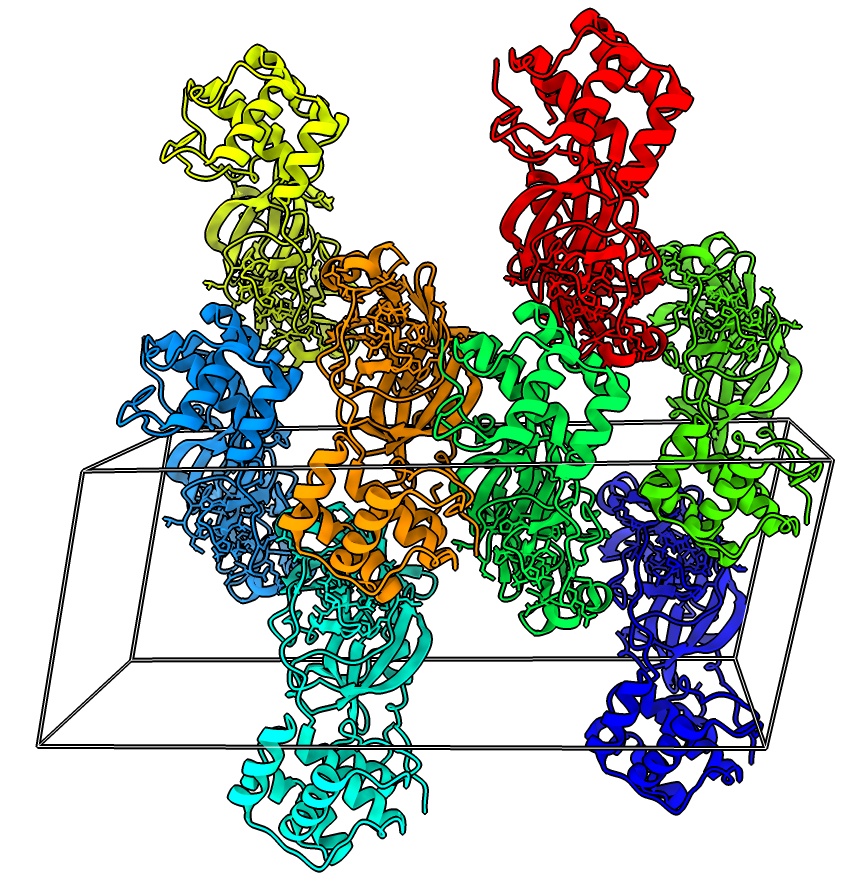
Crystallographic packing
- Show unit cell for 7rfw, menu Tool / Higher-Order structure / Unit Cell.
- Show 2 unit cells, under Options, number of cells 1 1 2
unitcell #1 cells 1,1,2
- Color each monomer differently
rainbow #3 structures
- Measure buried area between middle dimer, 1857 A**2
measure buriedarea #3.4 with #3.7"
- Measure buried area of smaller contact, 467 A**2
measure buriedarea #3.4 with #3.8"
- Buried area of typical biological interfaces > 500A.
- Delete copies and outline.
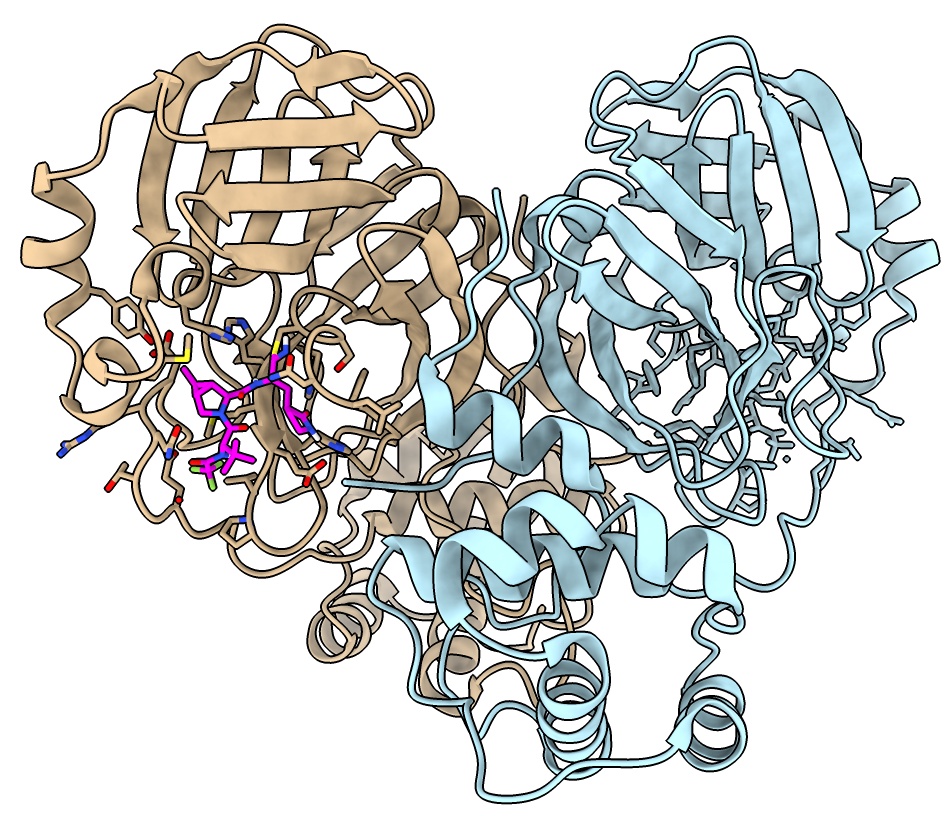
Biological assembly
PDB entries often define "biological" assemblies.
MPro is active as a dimer. Some have considered inhibiting dimerization as a covid therapeutic.
- Click assembly 1 in biological unit table in Log.
- Color monomers of dimer different from each other
color #3.2 lightblue
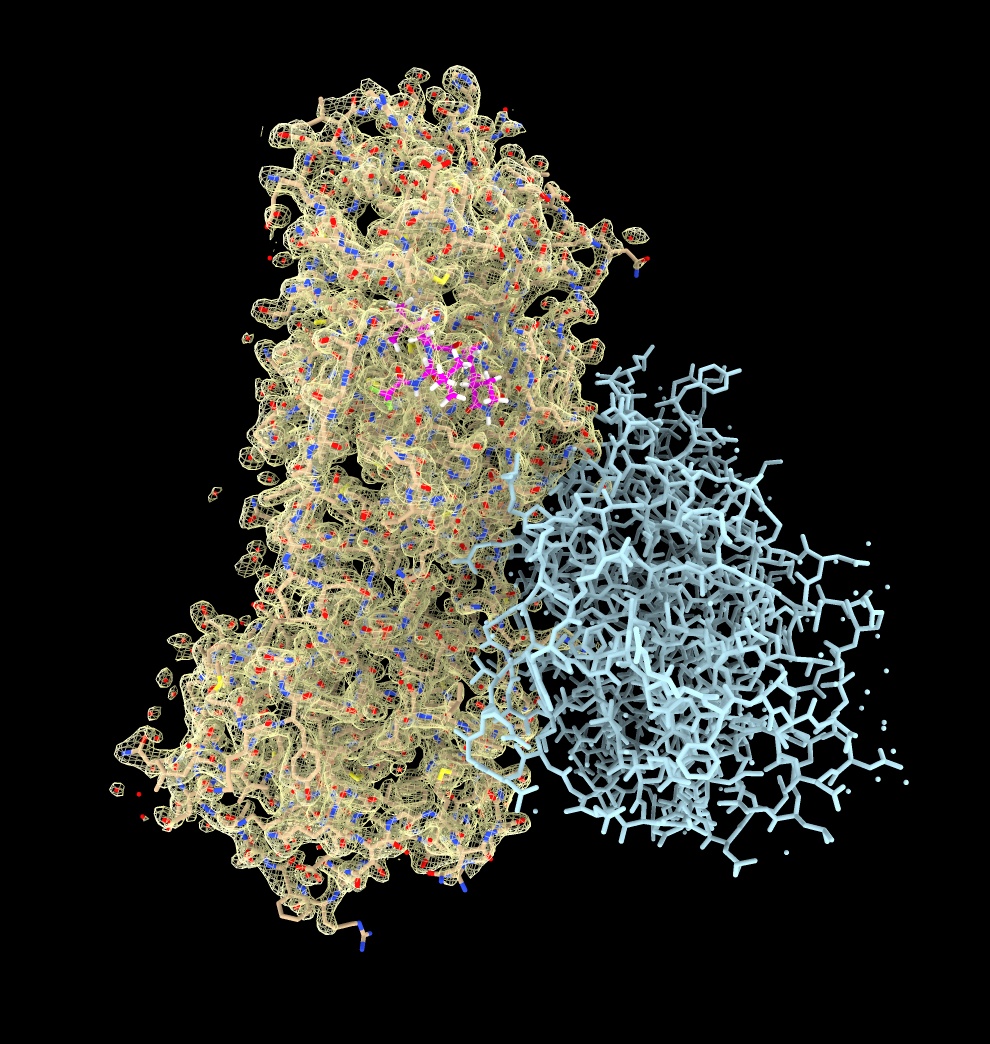
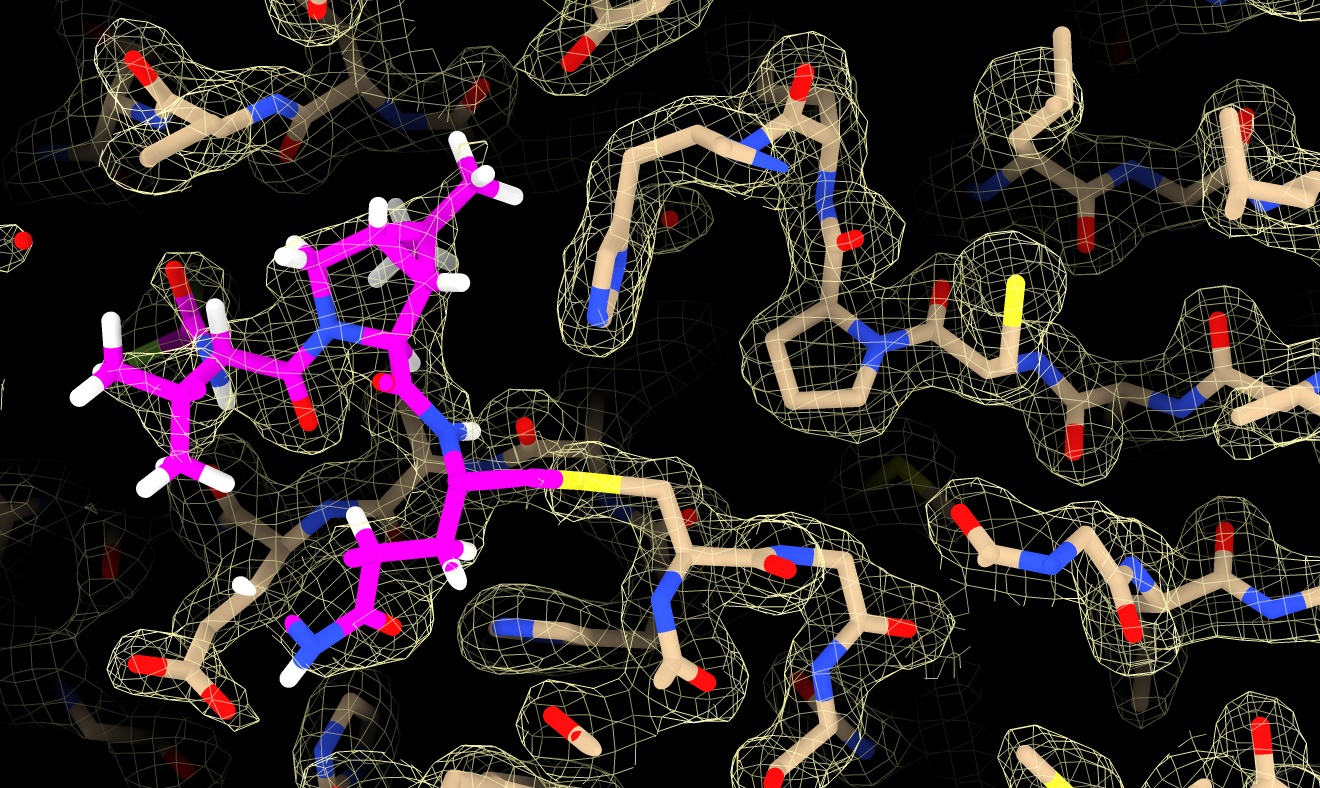
X-ray map display
The Electron Density Server database has X-ray maps for PDB entries.
Looking at map shows binding site side chains and ligand are well resolved.
May also see alternate side-chains positions at high resolutions.
- Open X-ray map, resolution 1.7A
open 7rfw from eds
- Show outline of map, ctrl-click on histogram to show menu, Show Outline Box.
volume #4 showOutlineBox true
- Make map cover the dimer atomic model
volume cover #4 atom #3
- Hide original map
volume #4 hide
- Show map only near atoms, use Tools / Volume Data / Surface Zone
surface zone #5 nearAtoms #3.1 distance 3.32
- Adjust threshold on histogram
volume #5 level 0.5
- Transparent mesh makes atoms more visible, use color button above volume histogram.
volume #5 transparency 0.5
- Show all atoms no cartoon using toolbar
hide #3 cartoon ; show #3 atoms
- Select ligand by ctrl-click atom then up-arrow key, and zone near ligand
select #3.1 & ligand
surface zone #5 nearAtoms sel distance 5
Clip planes
Clip to show a limited slab of density for a view without overlapped atoms.
- Show side view, menu Tools / General / Side View, drag near far clip planes (vertical lines).
clip near -5 far 5
- Use clip mouse mode from right mouse toolbar, cmd-drag to move front plane, shift-cmd-drag to move near and far planes.
mousemode right clip
- Turn off clipping with near/far checkbuttons on side view.
clip off
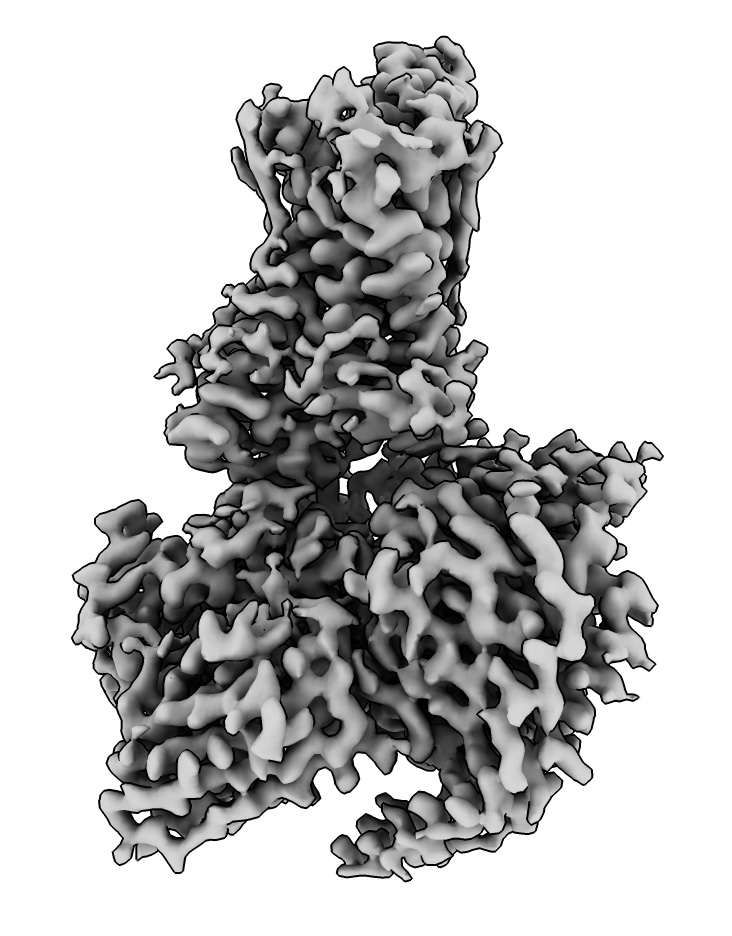
cryoEM structures and maps: Human olfactory receptor
Look at a human olfactory receptor (GPCR) with odorant molecule propionate bound,
solved by cryoEM at 3.1 Angstroms.
- Close previous models, Model Panel close button.
close
- Open PDB 8f76.
open 8f76
- Select chains from log table to identify olfactory receptor and G-protein and nanobody.
- Use Log "more info" link to download map or command.
open 28896 from emdb
- Hide atomic model using Model Panel
hide #1 model
- Show step 1, full resolution.
volume #2 step 1
- Raise volume contour level to hide noise using histogram bar.
volume #2 level 0.7
- Alternatively use recommended level of 0.54 that it started with and Map toolbar Hide Dust button.
surface dust #2 size 8.1
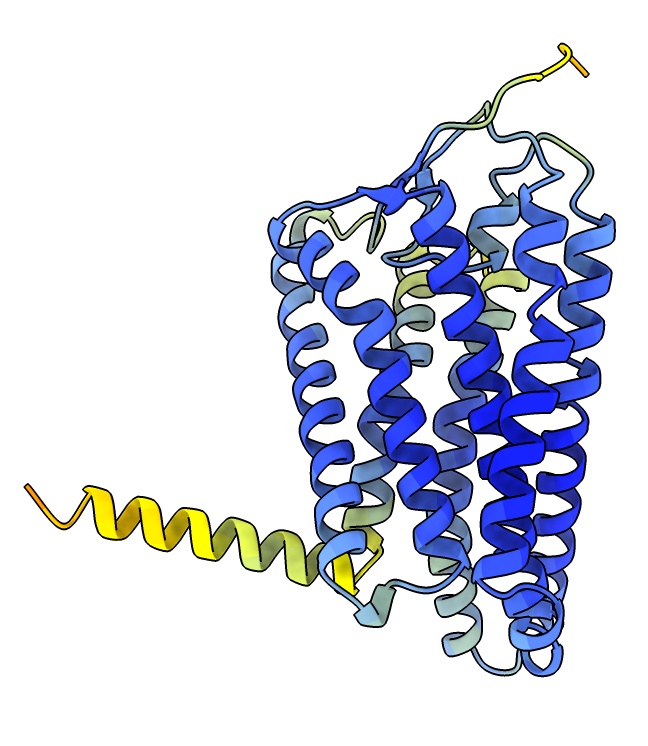
Using AlphaFold predicted structures
As a first step toward building a model into this cryoEM map we can try
to fit an AlphaFold model for the olfactory receptor part.
- Fetch a precomputed model from the AlphaFold database.
Use menu Tools / Structure Prediction / Alphafold, select Sequence / Uniprot Identifier / O51E2_HUMAN and press Fetch.
alphafold fetch O51E2_HUMAN
- If the sequence was mutated we could paste in the sequence and predict the structures, takes 13 minutes.
- Blue residues indicates high confidence score from AlphaFold.
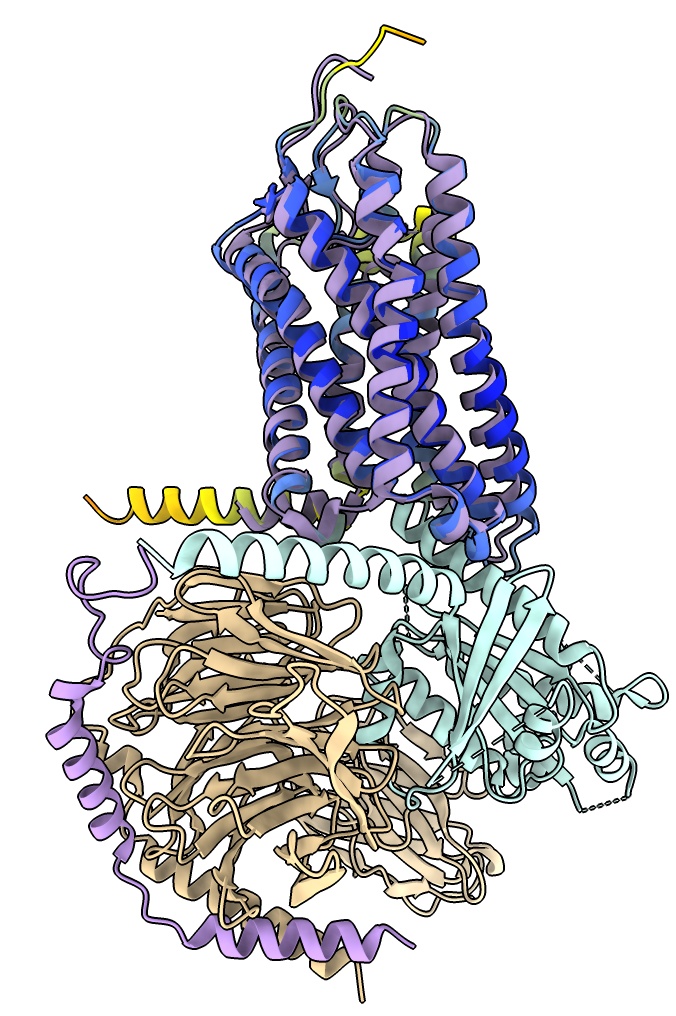
Fit AlphaFold model in map
To fit the AlphaFold model into the map we will position it by hand then optimize the position.
It is easier to position by hand if the map is smoothed so helices are clearly visible.
- Smooth map. Use menu Tools / Volume Data / Map Filter, Gaussian, width 2.
volume gaussian #2 sDev 2
- Use the Move Selected mouse mode under Right Mouse and select a residue of the AlphaFold model with ctrl-click. Translate and rotate with shift key to put in model in map map. Hint yellow helix goes near G-protein end.
view matrix models #3,0.40692,0.60876,0.68104,119.26,-0.29794,0.79324,-0.53104,111.11,-0.86351,0.013184,0.50416,91.549
- Use Map toolbar Fit button to optimize hand placement in map.
fit #3 in #4
- See how this initial model compares to final structure, hide map, show 8f76 as cartoon.
volume #4 hide
show #1 model,cartoon ; hide #1 atoms
- Ends of two long transmembrane helices near G-alpha subunit are displace several Angstroms,
possibly because of the interaction with the nearby G-alpha helix.
- Next step could be to use ISOLDE plugin to ChimeraX to refine the position
of all residues in the map with interactive molecular dynamics.
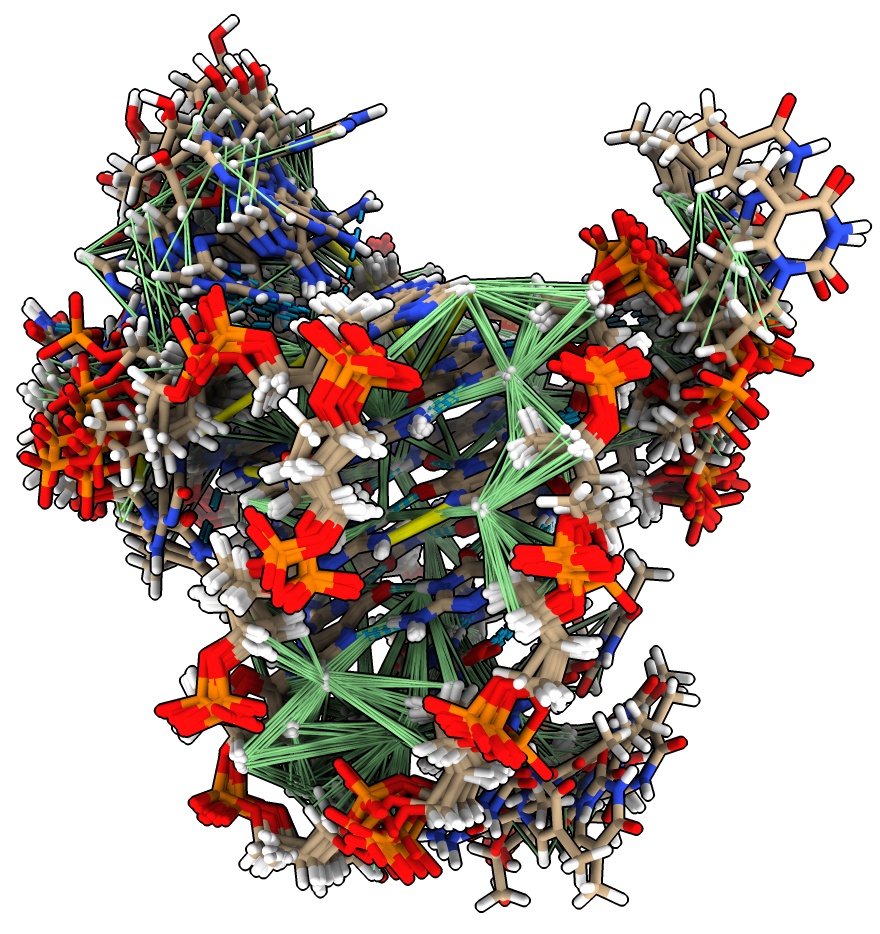
NMR ensembles and constraints: DNA quadruplex
Now we look at an NMR ensemble and NMR distance constraints for
a 25 base single-strand DNA that forms G-quadruplexes (4-bases hydrogen bonded to each other in a planar square pattern).
- Close previous models using Model Panel Close button.
close
- Open PDB 8r4w, ensemble of 10 structures
open 8r4w
- Fetch and show distance constraints with command
open 8r4w from pdb_nmr
- Fetch PDB NMR distance constraints requires the NMR-STAR file reader which is in ChimeraX daily build Jan 9, 2024 or newer, or it can be added to ChimeraX 1.7 using menu Tools / More Tools....
- Green lines are satisfied constraints, within maximum expected distance, yellow are too long in the structure.
- To play through the ensemble one model at a time show a slider with command
mseries slider #1
- Most of the distance constraints go to hydrogen atoms and won't be shown unless the hyrdogen atoms are shown,
so hide cartoon and show atoms for bases (Molecule Display toolbar Style plain).
hide cartoon ; show atoms ; nucleotides atoms
- Playing series shows less constrained peripheral regions can have different conformations.