Tom Goddard
April 5, 2022
AlphaFold estimates errors in predicted structures in two ways, one indicating if a residue is correctly placed in its local environment, and another indicating if domains are correctly positioned relative to one another. ChimeraX can show both kinds of AlphaFold error estimates using menu Tools / Structure Prediction / AlphaFold or the alphafold command.
There is a video demonstrating AlphaFold error visualization.
|
|
|
|
|
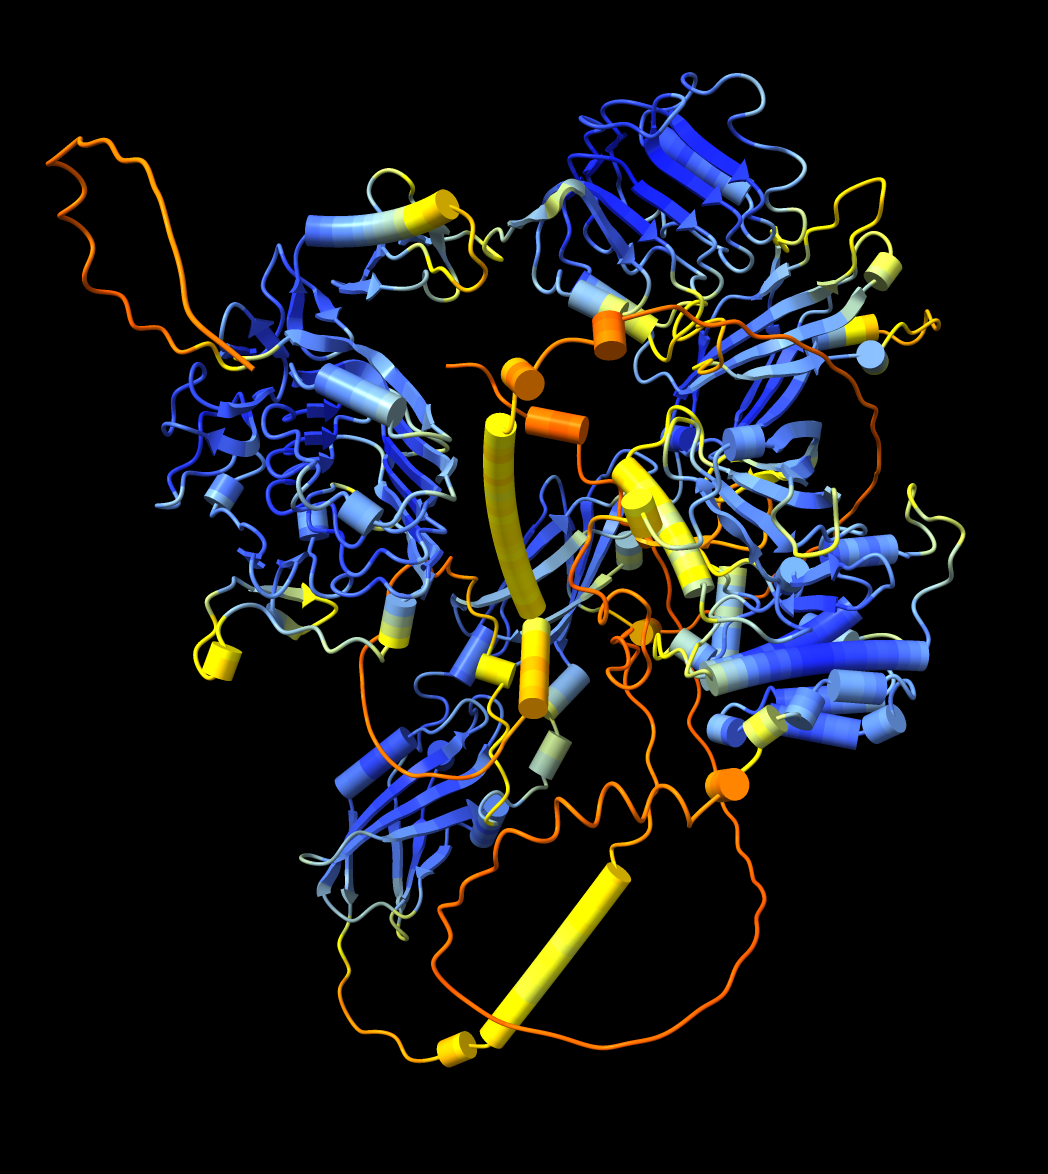
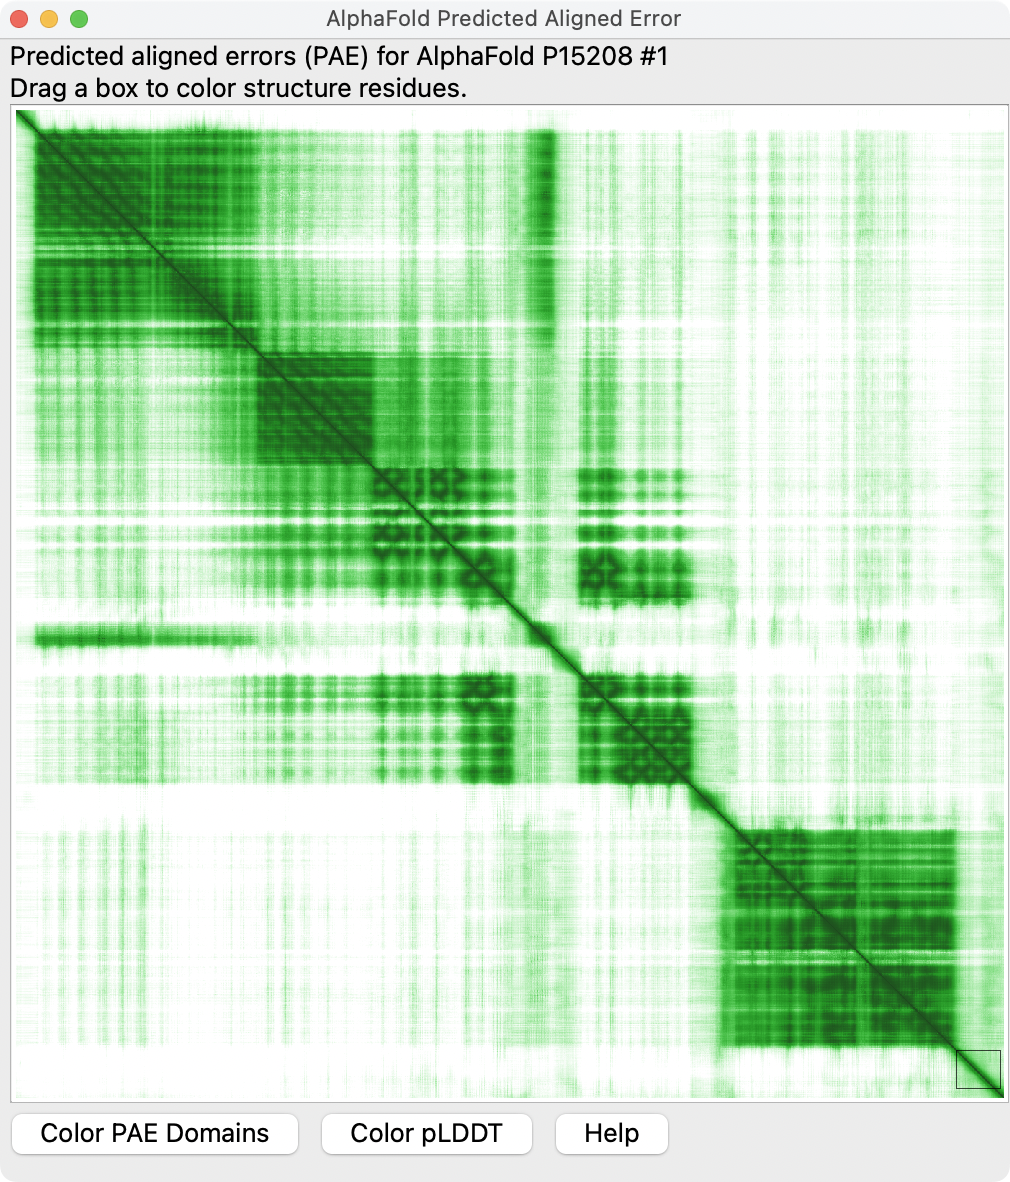
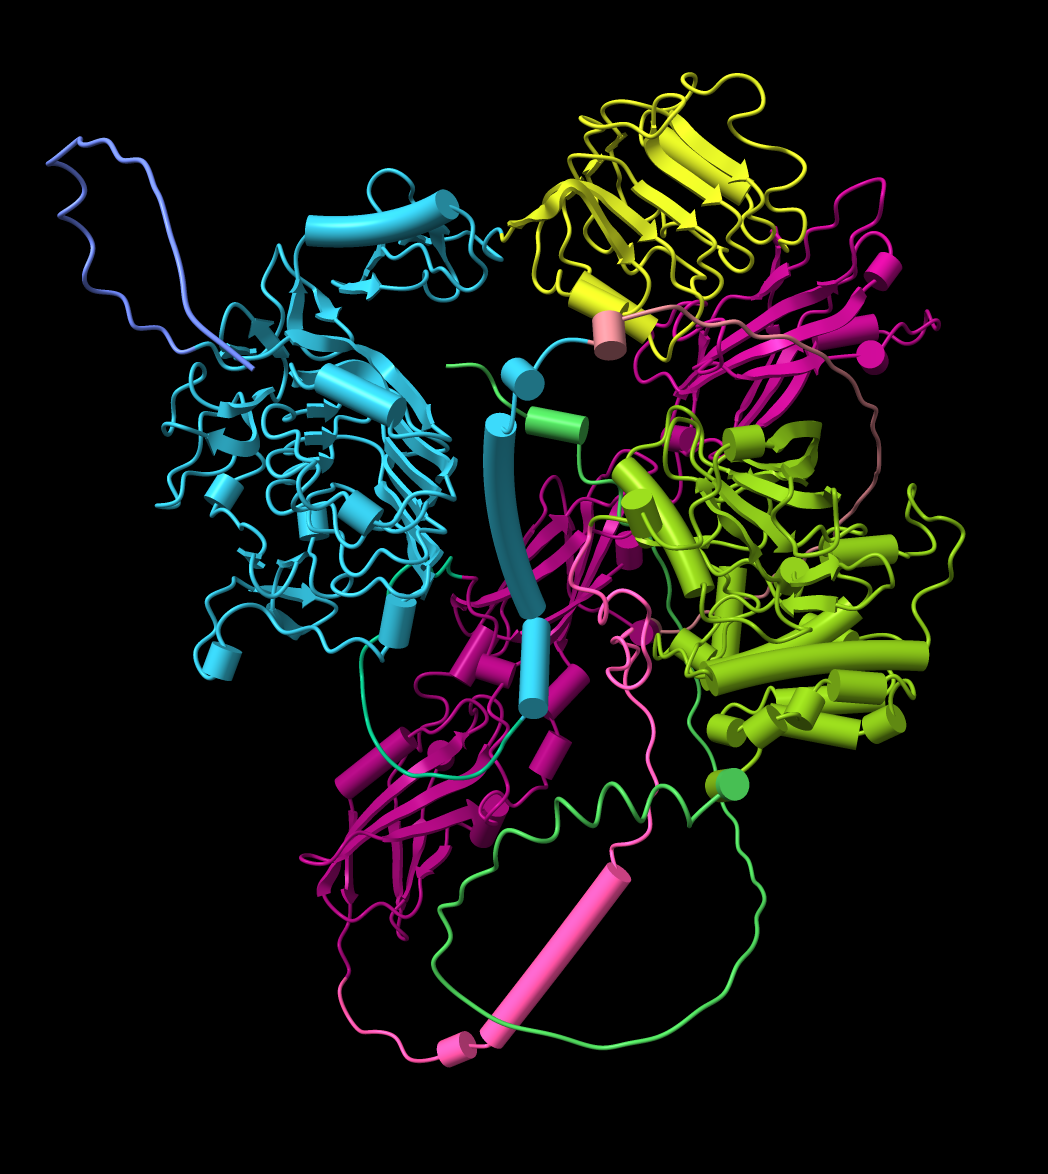
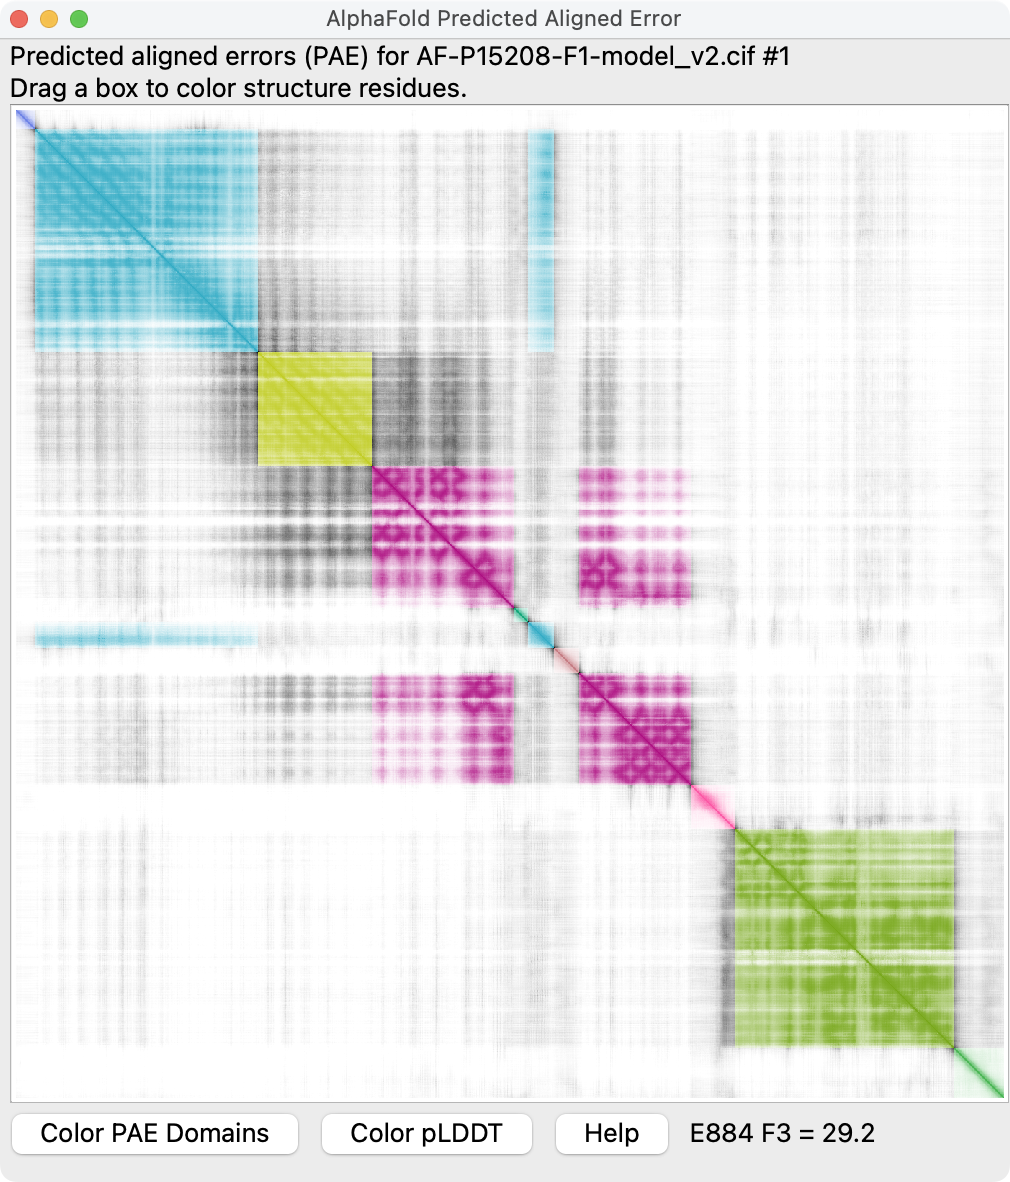
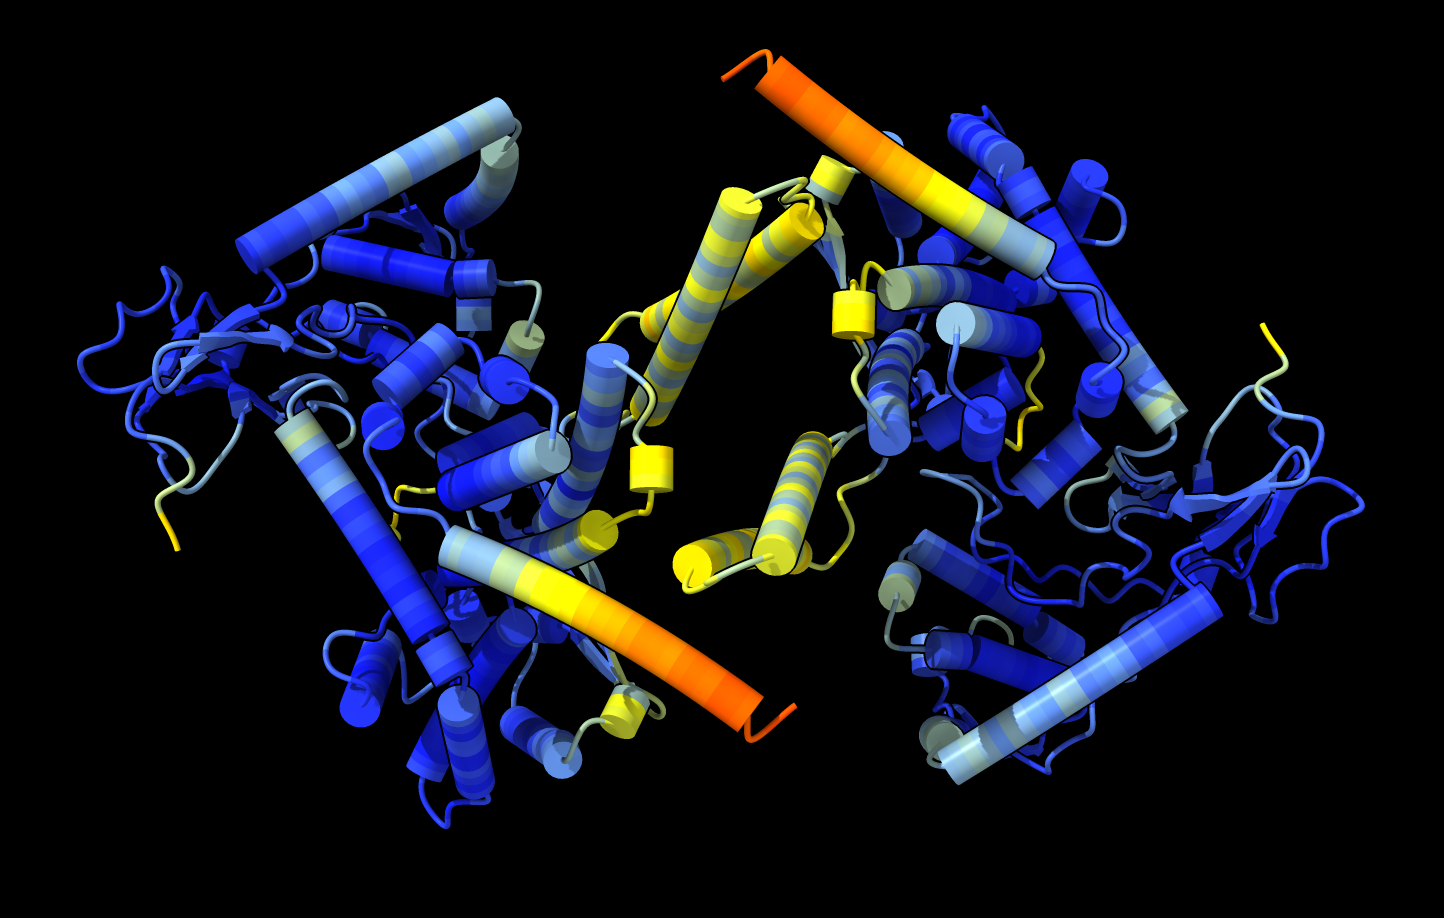
| Per-residue confidence coloring (pLDDT) for mouse insulin recepter, UniProt P15208. | Residue-residue alignment confidence (PAE) plot shown in ChimeraX. | Domains derived from PAE plot using a method from Tristan Croll. | Plot colored to match structure. Right-click or ctrl-click on plot and choose menu entry Color plot from structure. |
The predicted local distance difference test (pLDDT) score (0-100) is a per-residue confidence score, with values greater than 90 indicating high confidence, and values below 50 indicating low confidence. AlphaFold models are often shown with high confidence residues colored blue, and lower confidence in yellow, orange and red. This measure estimates whether the predicted residue has similar distances to neigbhoring C-alpha atoms (within 15 Ansgstroms) in agreement with distances in the true structure.
Predicted aligned error (PAE) gives a distance error for every pair of residues It gives AlphaFold's estimate of position error at residue x when the predicted and true structures are aligned on residue y. Values range from 0 - 35 Angstroms. It is usually shown as a heatmap image with residue numbers running along vertical and horizontal axes and color at each pixel indicating PAE value for the corresponding pair of residues. If the relative position of two domains is confidently predicted then the PAE values will be low (less than 5A) for pairs of residues wotj one residue in each domain.
The "Accuracy and Confidence" section of Enabling high-accuracy protein structure prediction at the proteome scale gives further explanations.
Here is an example where the PAE plot and default PAE domain coloring suggests some domain packing is correct when it is actually wrong. Adjusting the PAE domain clustering threshold can highlight the wrong domain packing.
 AlphaFold prediction of a DNA topoisomerase dimer. | 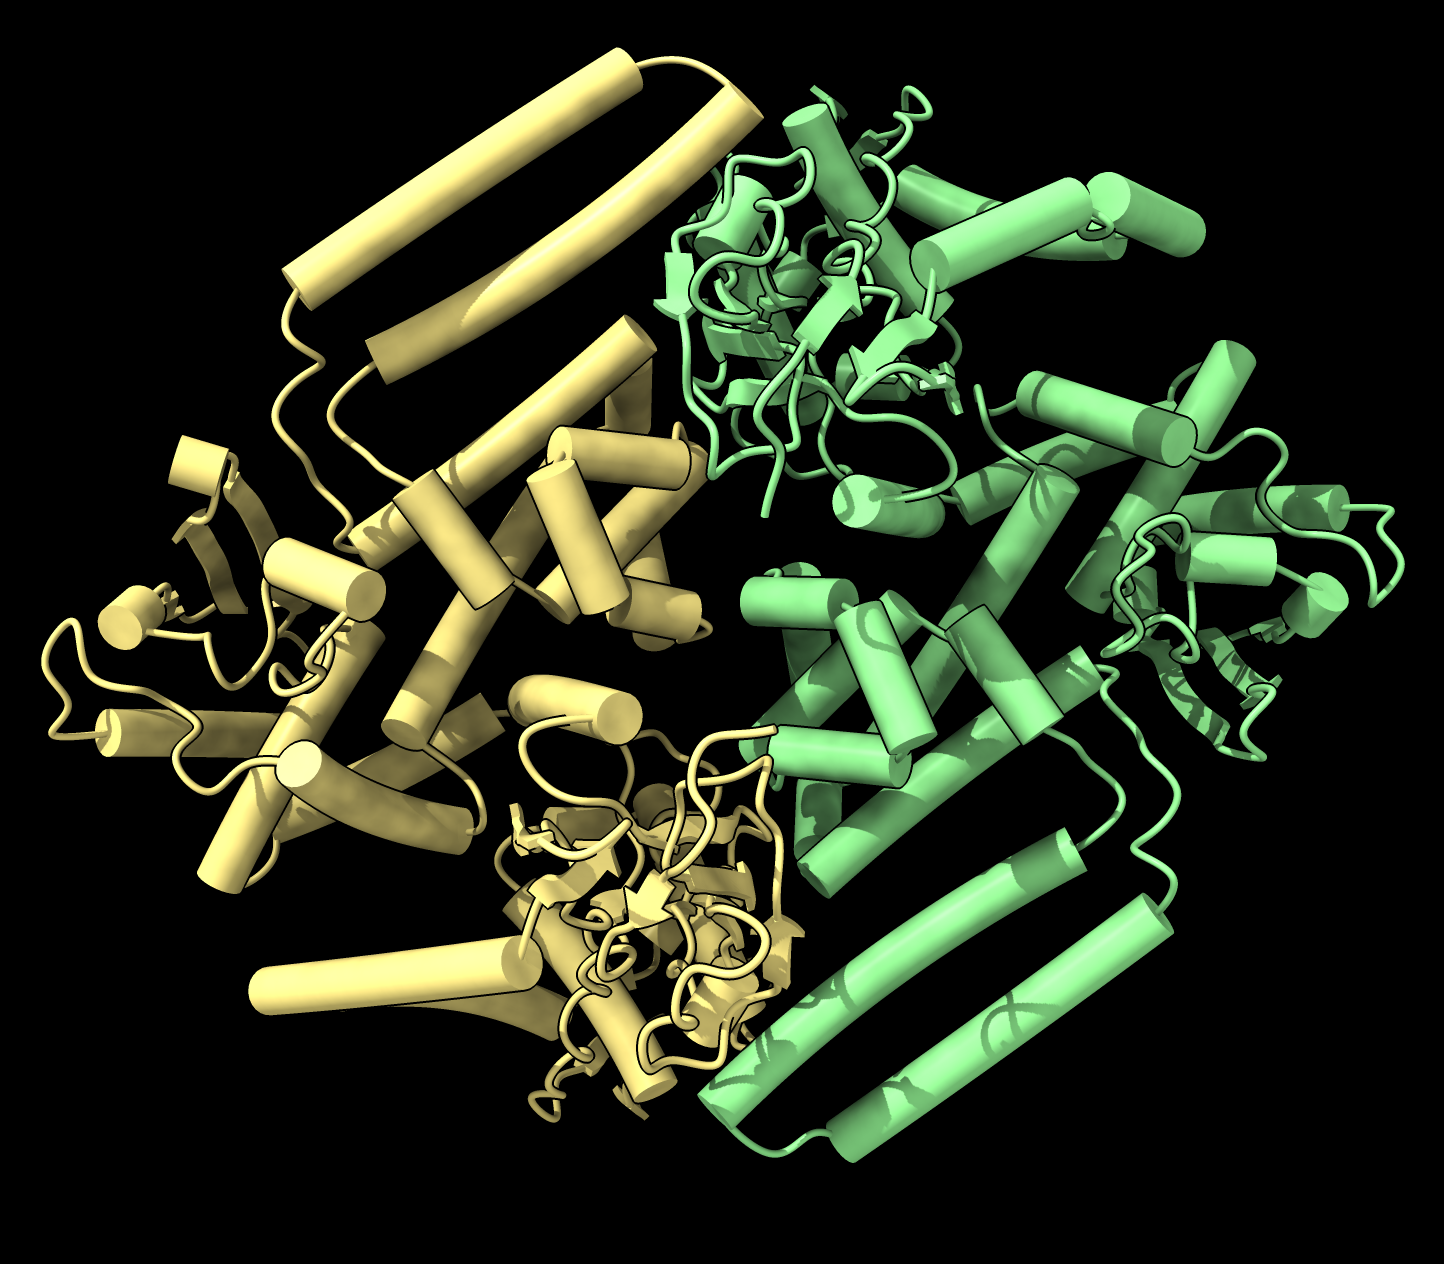 X-ray structure
PDB 6z03
dimer differs from AlphaFold.
X-ray structure
PDB 6z03
dimer differs from AlphaFold.
| 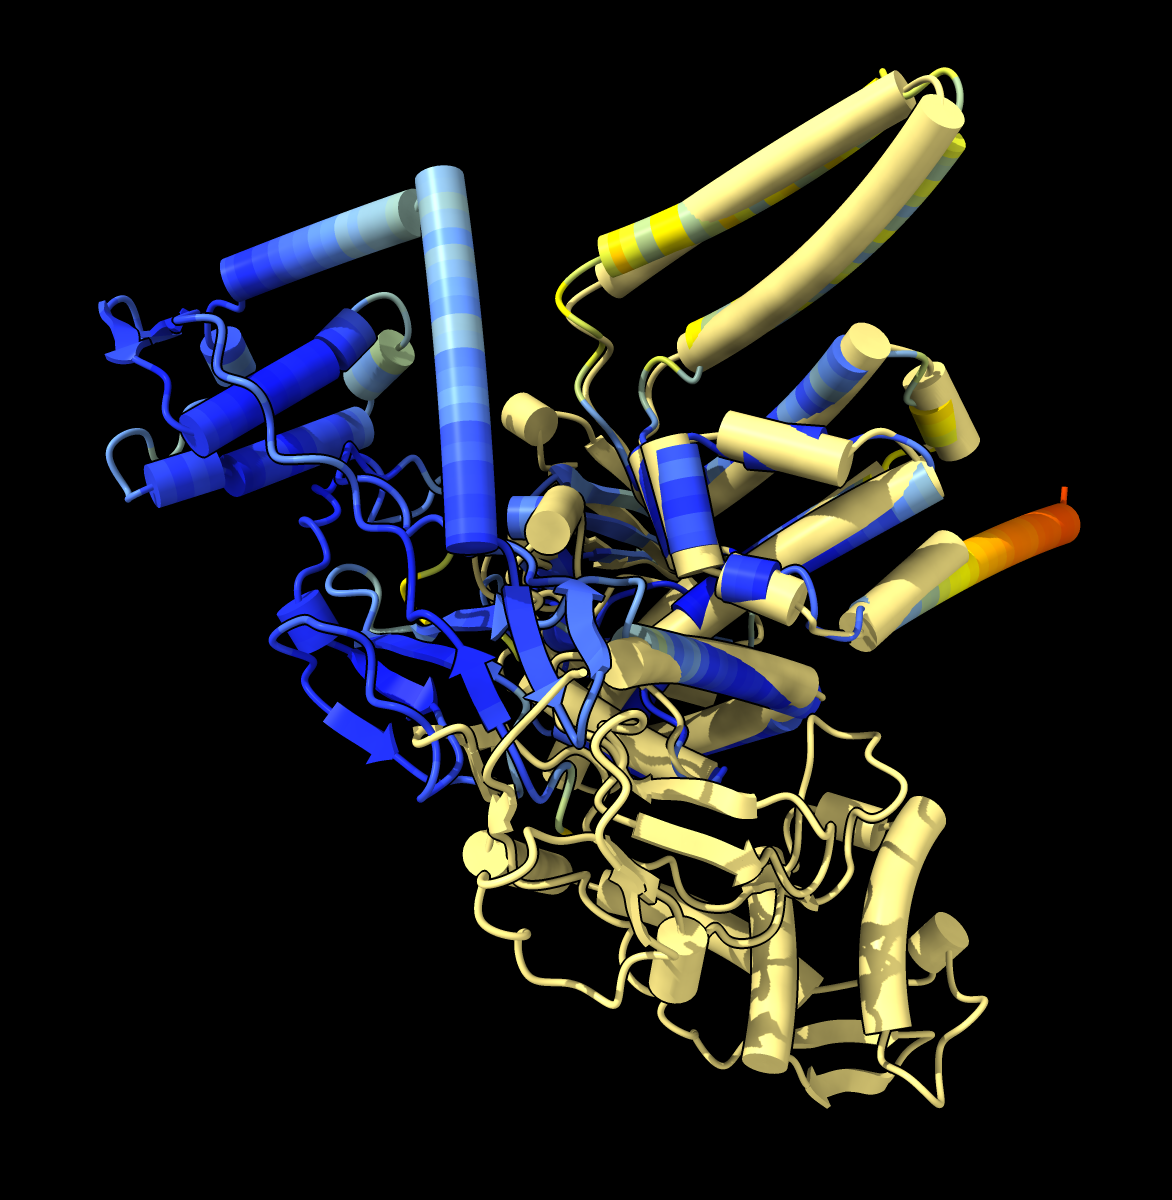 AlphaFold monomer conformation also differs from X-ray structure.
|
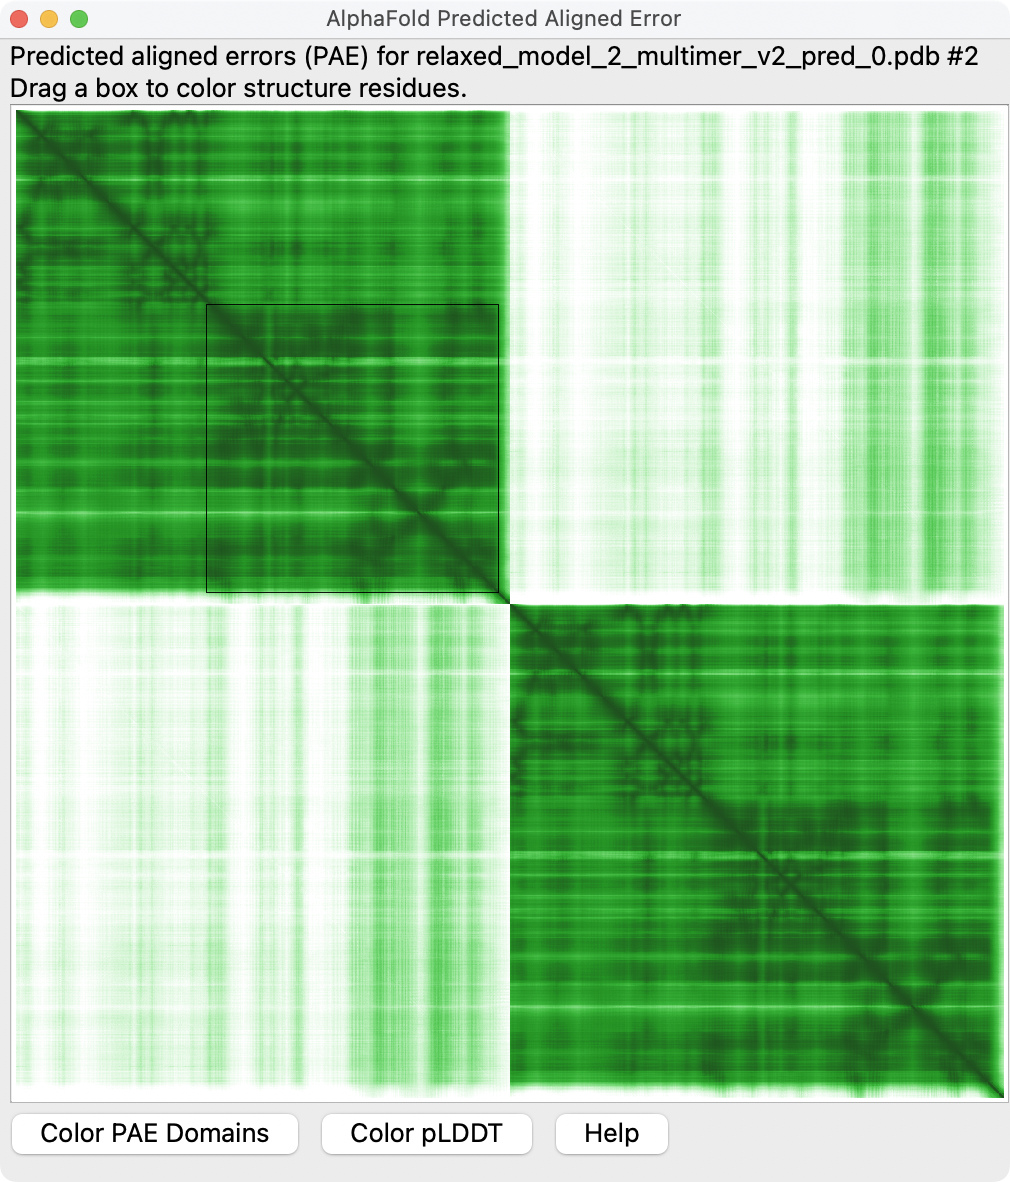 PAE plot suggests each monomer conformation is confident but dimer packing is low confidence. | 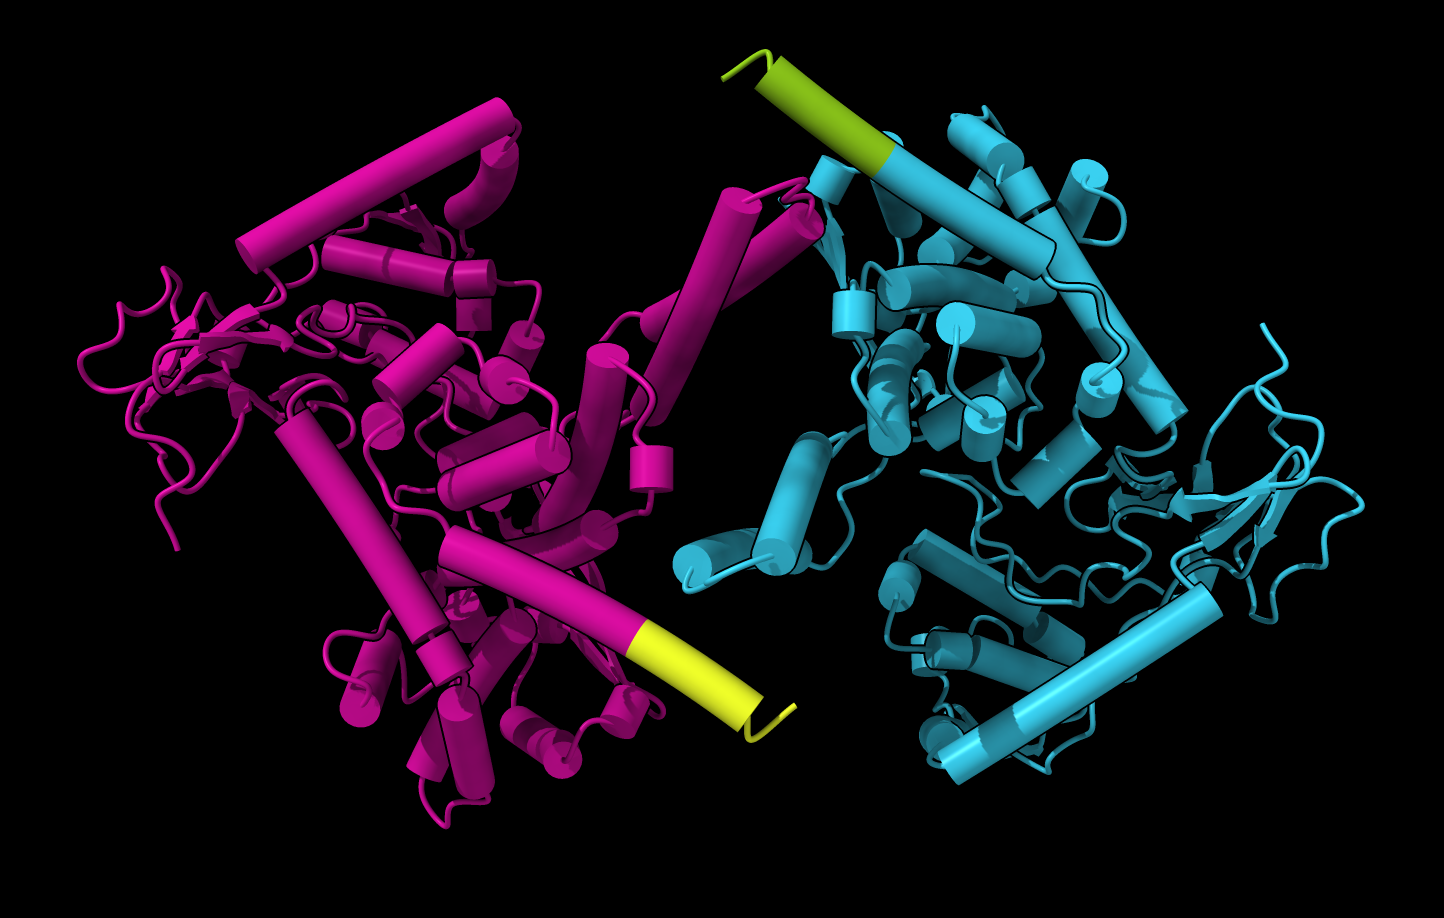 PAE domain coloring incorrectly suggests that monomers have correct fold. | 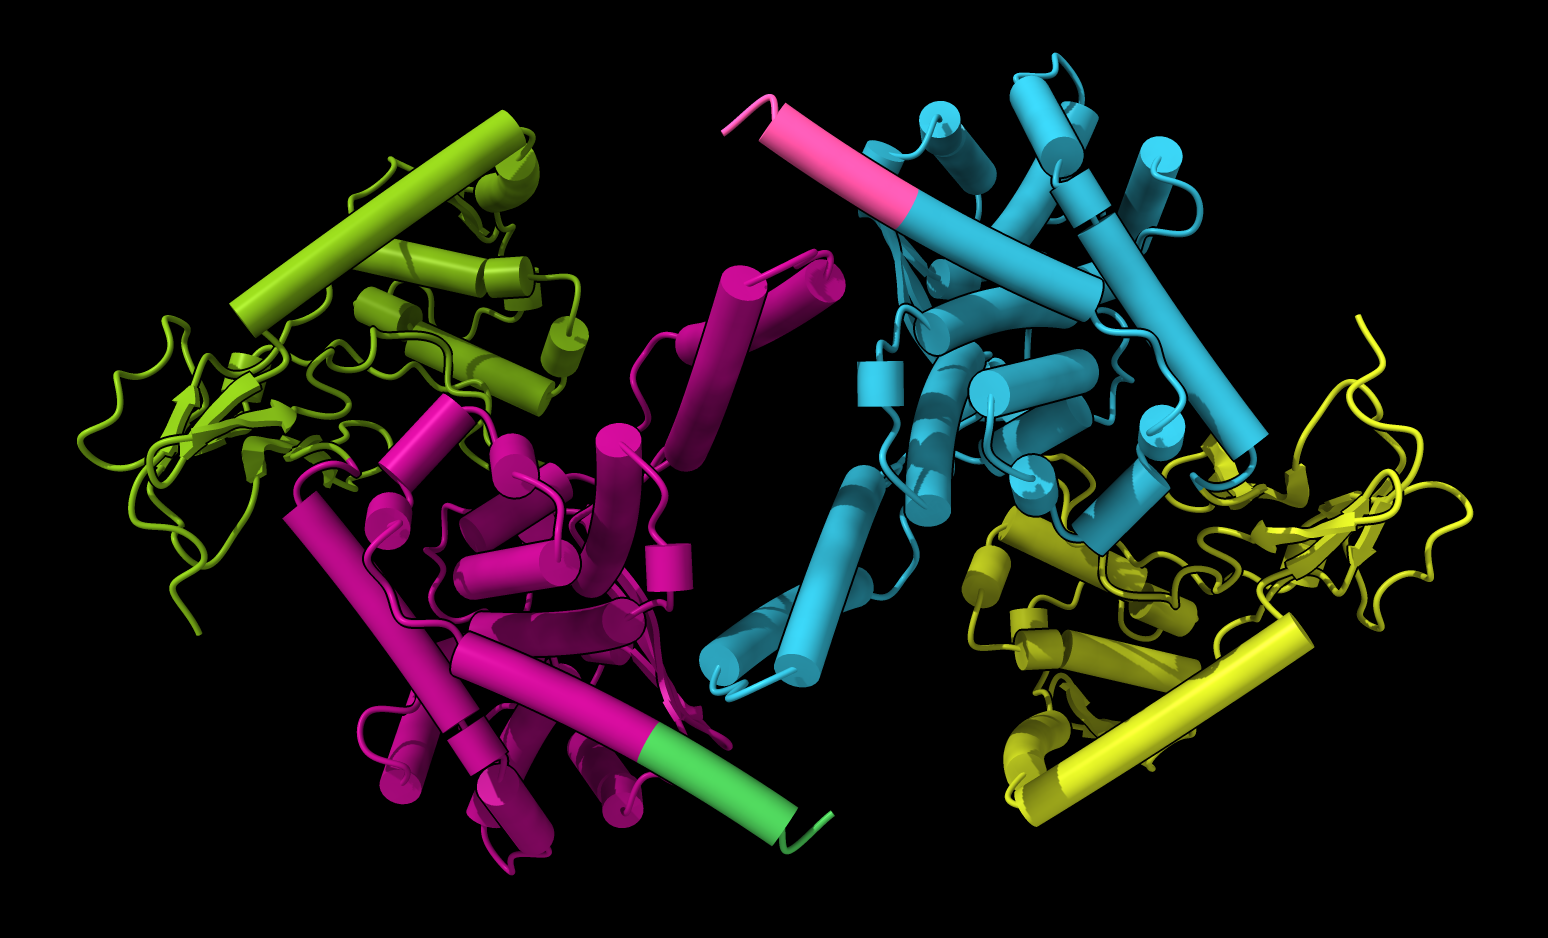 Tighter PAE domain clustering threshold reveals
uncertainty in monomer conformation. ChimeraX command
Tighter PAE domain clustering threshold reveals
uncertainty in monomer conformation. ChimeraX command
"alphafold pae #1 color true cluster 2". |