Tool: Mutation Scores
The Mutation Scores tool shows the results of deep mutational
scanning on protein structures and as interactive 2D plots.
The corresponding command is
mutationscores.
See also:
ChimeraX visualization of mutation scores
Deep mutational scanning generally entails making all possible
substitutions (of the 20 standard amino acids) at each position of a protein
and assessing the results with multiple high-throughput assays.
For example, the assays could include growing cells expressing the mutants
in the presence of different drugs and measuring cell viability or fluorescence.
In this page, mutant refers to a variant of the protein
defined by a specific residue type (which could be the same as the wild type)
at a specific position in the sequence, and in which
all of the other positions have the wild-type residue.
The result of a synonymous mutation is the same amino acid
as in the wild-type protein, although the nucleic acid codon could
have been different.
In general, each type of assay yields a score for each mutant.
The scores are read from a mutation scores .csv file
(details...) that can be opened
from the the File menu
or with the open command.
Each file gives rise to a mutation set,
and multiple mutation sets can be open at the same time.
A mutation set can also be fetched
from the AlphaMissense database (score name amiss) or from
UniProt Variants (score names PolyPhen and
SIFT).
Opening a mutation scores file automatically shows the
Mutation Scores tool.
By default, mutation scores are automatically associated with
each structure chain that has exactly the same sequence and residue
numbering (as in the mutation data) when the mutation data or structures
are opened.
However, specific structure chains to associate can be designated with the
chains option of the
open command
at the time of opening the mutation data, or the associations
can be adjusted manually later (after opening the files)
with mutationscores
structure.
[back to top: Mutation Scores]
Mutation Scores Dialog
Opening a
mutation scores file
automatically shows the
Mutation Scores tool.
It can also be opened from the Structure Analysis
section of the Tools menu, but will be “empty”
unless mutation data have been opened.
The filename of each open mutation set and the scores it contains
are listed in the dialog and can be chosen (highlighted) with the mouse.
Buttons across the bottom use the chosen data for various analyses:
- Heatmap
– plot the chosen scores (or all, if none are chosen)
as a heatmap
- Scatterplot
– show the first two scores (of the chosen set, or of all if none
are chosen) as a scatterplot
- Histogram
– plot the first score as a histogram
- Color structure
– show the Mutation Structure Coloring dialog
- AlphaFold structure
– fetch an AlphaFold Database predicted structure using the mutationscores alphafold command
- Close data
– close the mutation set
- Help – show documentation in the
Help Viewer
[back to top: Mutation Scores]
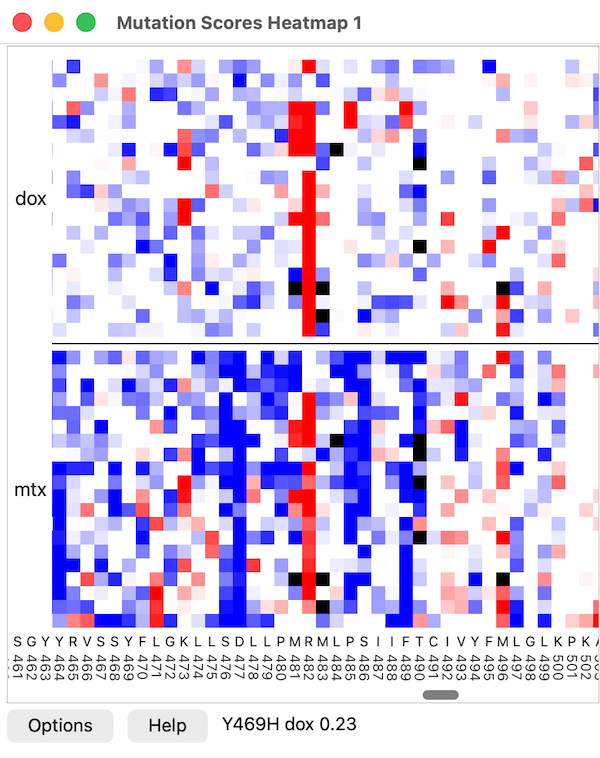
Mutation Scores Heatmap
A heatmap shows mutation score values with colors. By default,
low values are blue, those near the synonymous mean are white,
and high values are red. Black squares indicate missing data,
and black horizontal lines are drawn between different scores
in the same heatmap.
Residue positions along the chain are plotted on the horizontal axis, and
amino acid types along the vertical axis.
Moving the cursor over the heatmap reports the mutation name,
score name, and value in a pop-up balloon (transiently) and in
the status area next to the Help button.
Clicking Options shows/hides several settings;
press return after entering a new value to update the plot:
- Mutations – which mutation set
to use; currently, a single heatmap cannot include scores from more than one
- Score names – which scores to include, entered directly
as a comma-separated list of score names, or by clicking Choose
and using the checkboxes in the resulting dialog
- Amino acid order
– top-to-bottom order of amino acid types along the vertical axis,
entered as an uppercase string of amino acid 1-letter codes
(the default HRKDEFWYNQILCSTVMAGP groups chemically similar types);
all 20 standard types may be included, or a subset to limit the plot to
only those types
- Group by – if more than one kind of score is included,
group vertically by amino acid type or by score name (default)
with black horizontal lines between the different scores
- Label every residue (default off)
– whether to label every position along the horizontal axis
- Zoom factor – side length in pixels of the
colored square representing each mutation (default 2)
- Colormap – three colors are used
(default blue, white, red
),
where the middle color is bracketed by two thresholds (default thresholds
-2, -1, 1, 2; the units are standard deviations from the mean
if Normalize scores is on)
- No value color – color to use for missing data
(default black
)
-
Normalize scores (default on)
– whether to express scores in standard deviations above (positive)
or below (negative) the mean, with mean and standard deviation computed
separately for each score using synonymous mutations only, or if there are
no synonymous mutations, all mutations; otherwise,
the raw values from the data file will be used.
Only a single colormap is allowed for the whole heatmap, so if raw scores
are used, all of the scores in the heatmap should have comparable ranges.
- Subtract fit (default off)
– all scores can have a linear fit using a specified score subtracted.
For instance, for a membrane receptor with scores representing activity in
the presence of different drugs, a linear fit of drug score versus a cell
surface expression score can be subtracted to compensate for different
abundance of the receptor on the cell membrane.
A least-squares fit is used between drug and surface score.
- Gray missing structure residues (default off)
– whether to modulate the heatmap cell color with the specified color
(default #CCCCCC
)
for heatmap cells where
the associated atomic structure is missing residues.
If multiple chains are associated, then mutations are grayed if none of the
chains have the mutated residue.
- Drag box to select or color structure
(default color structure with color yellow
and linewidth of 3)
– whether dragging a box with the mouse on the heatmap
colors associated structure residues and atoms.
By holding the Shift key, multiple boxes can be drawn on
the heatmap, and they can be different colors. Clicking on a mutation
will color a single residue, and clicking outside the heatmap
(such as on the axes) will clear the boxes and revert the residues
to their original colors. If select is enabled,
dragging a box clears the current selection
and selects the associated residues.
If the Shift key is held while dragging, the residues are
added to the selection instead of replacing it.
- Hover colors structure residue (default off)
– whether placing the mouse over the heatmap colors the
associated structure residues the specified color
(default yellow
).
No mouse button needs to be pressed, and the coloring of the structure
changes immediately when the mouse moves over another mutation.
This facilitates exploring the correspondence between heatmap and
structure positions.
Buttons:
- Show selected residues
– limit the heatmap to include only mutations for
the currently selected structure residues
- All residues
– show mutations for all residues,
even those missing from associated structures
- Save image
– save a PNG image of the entire heatmap, even if only a subregion
is shown on the screen. The image includes the axis scales.
[back to top: Mutation Scores]
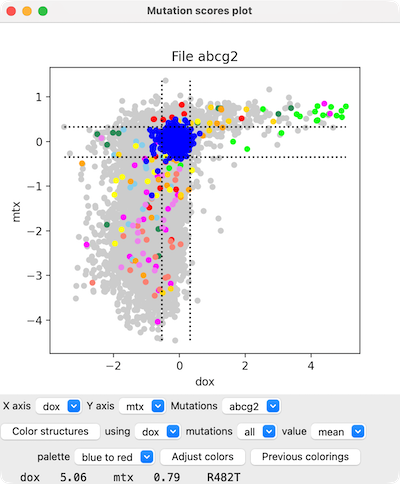
Mutation Scores Scatterplot
Menus below the plot can be used to change which scores are plotted
on the X- and Y-axes and for which mutation set.
Placing the cursor over a plotted point (circle)
reports the specific mutation and its score values at the bottom of the panel.
Clicking the scatter plot raises a context menu; entries that refer to
a specific mutant only appear when the click is on a circle, and some entries
only appear if there is an associated structure:
- Mutation [mutant]
– information for the user (no action): which mutant was clicked
- Color mutations for [mutant position]
– color in green all circles representating mutations at the
same position as the clicked mutant
- Color mutations near residue [mutant position]
– circles representating mutations at positions within 3.5 Å of
the position of the clicked mutant (in the 3D structure of the
associated structure(s))
- Color mutations for selected residues
– color in cyan all circles representing mutations at positions
of residues selected in the
associated structure(s)
- Color synonymous mutations blue
– color in blue all circles for “mutants” with
the same residue type as the wild-type protein
- Hide (Show) synonymous bounds
– dashed lines delimiting mean ± 2 standard deviations
of results for mutants with the same residue type as the wild-type protein
- Ctrl-drag colors structure
– Ctrl-dragging a rectangle in the plot shows the enclosed circles in
green and selects the corresponding
structure residues; this option indicates whether to also color
the corresponding structure residues lime
and the other structure residues light gray
- Clear plot colors
– color all circles gray
The following entries apply to the
associated structure(s):
- Structure residue [mutant position in structure]
– information for the user (no action): the corresponding structure residue
- Select
– select the corresponding residue
- Color green
– color the ribbon and carbon atoms of the corresponding residue green
- Color to match plot
– color the ribbon and carbon atoms of the corresponding residue to match
the circle in the plot
- Show side chain
– show the sidechain atoms of the corresponding residue
- Zoom to residue
– zoom and clip to focus the view on the corresponding residue;
clipping can be turned off with clip off,
or with view to view all
- Label with [x-score] scores
– label the corresponding residue with a
color-coded grid of the x-score
values for all substitutions at that position; the grid
can be removed with label delete
- Label with [y-score] scores
– label the corresponding residue with a
color-coded grid of the y-score
values for all substitutions at that position; the grid
can be removed with label delete
The following relate to additional windows or dialogs:
- New plot
– duplicate the current plot window to allow changing one copy
while retaining the settings of the other
- Save Plot As... save the scatter plot as an image file
(PNG, SVG, or PDF)
- Show histogram
– show a histogram of the X-axis values
- Show structure coloring panel
– show the
Mutation Structure Coloring dialog
[back to top: Mutation Scores]
Mutation Scores Histogram
Clicking the histogram raises a context menu, including:
- Switch log (linear) to linear (log) scale
– type of histogram bar scaling
- Hide (Show) synonymous
– blue histogram bars showing results for “mutants”
with the same residue type as the wild-type protein
- Hide (Show) synonymous bounds
– dashed lines delimiting mean ± 2 standard deviations
of results for mutants with the same residue type as the wild-type protein
- Ctrl-drag colors structure
– Ctrl-dragging a rectangle in the plot
selects the corresponding
structure residues; this option indicates whether to also color
the corresponding structure residues lime
and the other structure residues light gray
- New histogram
– duplicate the current plot window to allow changing one copy
while retaining the settings of the other
- Save Plot As... save the histogram as an image file
(PNG, SVG, or PDF)
[back to top: Mutation Scores]
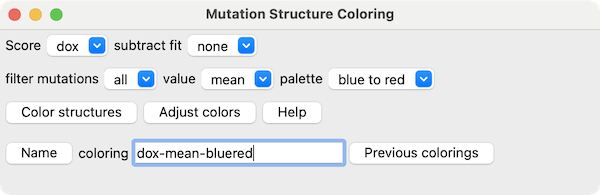
Mutation Structure Coloring
The Mutation Structure Coloring dialog can be shown by:
In this dialog, clicking Color structures colors any
associated structures
using the Score chosen from the menu, optionally
normalized by linear least-squares fitting to a subtract fit score
and subtracting the linear values
(if the subtract fit score is not set to none;
details...).
An attribute named mutation_score
is assigned to the associated structure residues.
If the coloring is subsequently named/saved,
the attribute name is changed to match the name of the score.
There are typically several different mutations at the same
residue position, whereas a single value per position is needed for coloring.
This single value per position can be calculated based on
a filter mutations setting of all mutations
(i.e., unfiltered) or only those enclosed in a
drag box on scatterplot (specific ranges of values of the two scores
shown in the scatterplot), or define ranges...
to choose only specific ranges of one or more scores
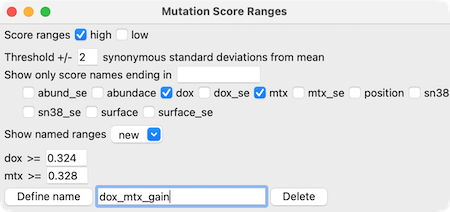
in the Mutation Score Ranges dialog.
For example, in the image of the Mutation Score Ranges dialog on the
right, only mutations with dox and mtx greater than 2 standard
deviations from the mean would be included. A name for the range set
can be entered for later use, and will be listed in the Show named ranges
menu in this dialog and the filter mutations menu in the
Mutation Structure Coloring dialog.
If the low were checked instead of high, values lower than
the specified threshold (number of standard deviations from the mean)
would be included instead. Both low and high can be checked
for the same score to limit it at both extremes; in that case, the
threshold values should be adjusted from the defaults so that the lower
limit is below the upper limit.
The single value per position can be computed as one of:
- mean – average of values
- count – how many different mutations are being used
- sum absolute – sum of absolute values
- sum
- min
- max
- median
- stddev – standard deviation
Choices of palette for coloring by mutation scores include:
- blue to red
– with blue, white, another white, and red thresholds
- red to blue
– with red, white, another white, and blue thresholds
- white to red
– with white and red thresholds
- red to white
– with red and white thresholds
- white to blue
– with white and blue thresholds
- blue to white
– with blue and white thresholds
The colors are in low → high value order in the names above, and
the thresholds are placed to span four standard deviations centered on the mean:
- at -2 and +2 standard deviations from the mean for two-color palettes
- at -2, -2/3, +2/3, and +2 standard deviations from the mean
for four-color palettes
Clicking Adjust colors shows the
Render by Attribute tool
for interactively moving the thresholds and/or changing their colors.
Clicking Name saves the current coloring settings to
the specified name. Subsequently clicking
Previous colorings shows a “Mutation Coloring History” table
allowing previously saved colorings to be chosen and easily reapplied
(see also mutationscores
color). There are buttons below the table to:
- Adjust colors for that coloring with
Render by Attribute
- Rename a chosen coloring
- Save .csv one or more chosen scores (if none are chosen, all)
to a comma-separated values file with fields:
residue number, residue type, score1-name, score2-name, ...
- Delete one or more chosen colorings
UCSF Resource for Biocomputing, Visualization, and Informatics /
May 2026