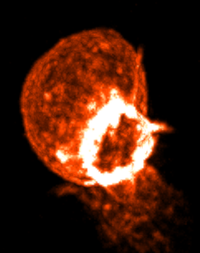
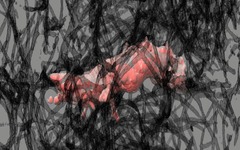
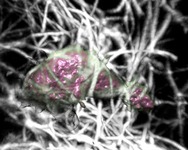
Actin ring visualization and instructions on how to process and enhance contrast in ChimeraX. April 21, 2017.
Tom Goddard
updated July 19, 2017
These are links to movies of cell motion captured with 3-dimensional optical microscopy time series data acquired by Lillian Fritz-Laylin in Dyche Mullin's lab at UCSF using Eric Betzig's Bessel beam microscope at Janelia Research Campus. The data shown is from November 2012 (without collagen matrix) and March 2013 (with collagen matrix).
|
|
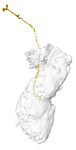
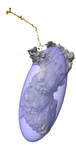
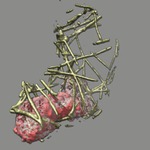
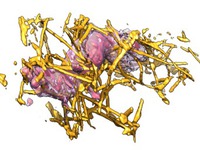
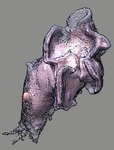
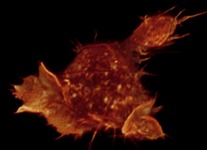
Actin ring visualization and instructions on how to process and enhance contrast in ChimeraX. April 21, 2017. |
| 
|
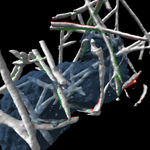
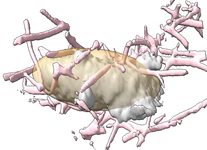
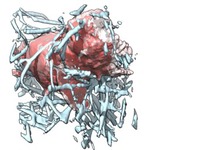
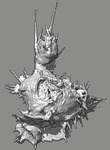
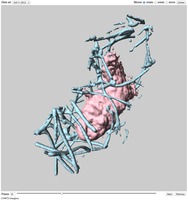
Deflection of collagen as cell pushes and pulls on it shown with red and green hairs. October 15, 2014. |
| 
| 
| 
|
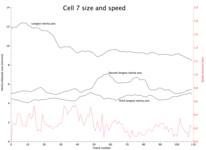
Cell size and speed plotted as a function of time. Shows cell centroid position and moments of inertia as a measure of size. October 7, 2014. |
| 
| 
| 
|
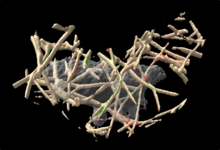
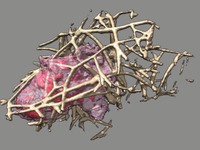
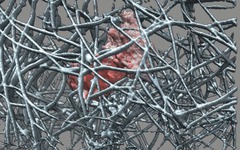
Collagen only near moving cell gives clearer view of interaction of cell with matrix. March 3, 2014. |
| 
| 
|
Cell motion through collagen matrix. Tried interpolating between 3-d images for smoother motion between experimental images which were sampled at approximately 1 second intervals. December 6, 2013. |
| 
| 
| 
|
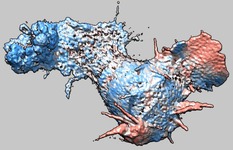
HL60 cell motion on a slide with no collagen. Includes example coloring according to how fast cell surface is moving. Includes stereoscopic movie (left and right eye movies). February 15, 2013. |
| Cell motion viewer using WebGL to allow rotating surface depictions of cells and collagen and placing markers. |
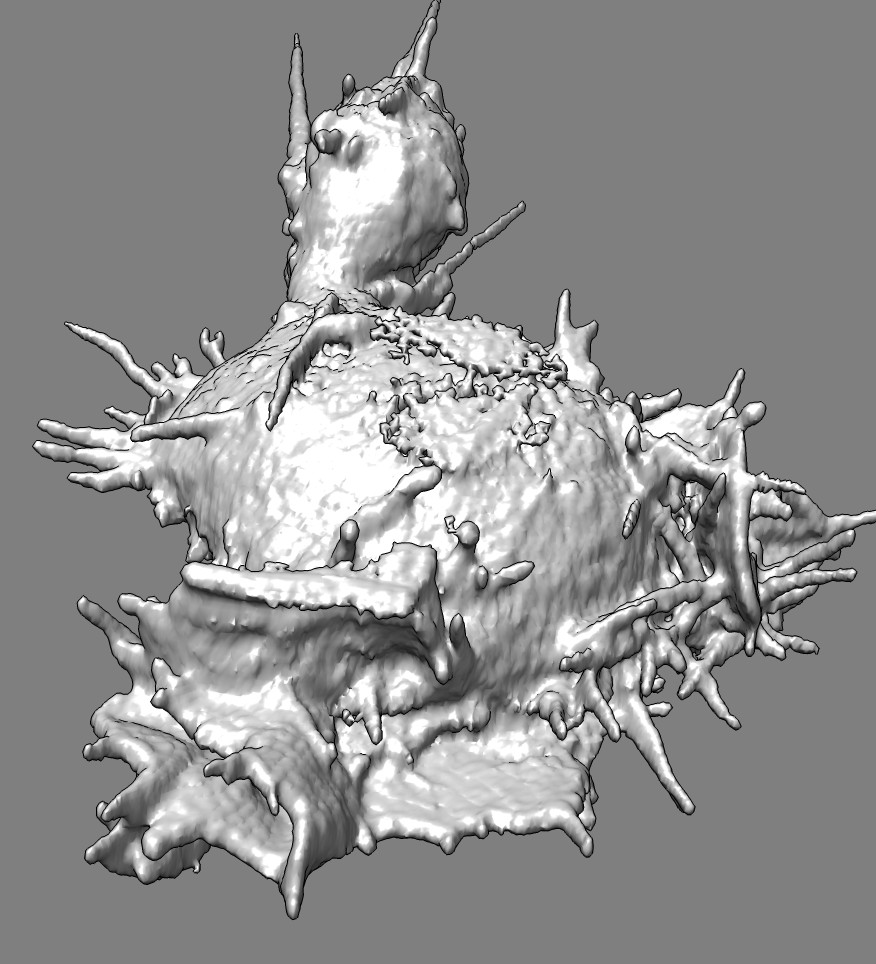
| Here is the surface file (24 Mbytes) for one frame of HL60 cell7 from Nov 7, 2012 for printing on a 3d-printer. |
The following collagen and cell map time series files are each 2.5 Gbytes in size -- they are subsampled versions of the deconvolved data taking every other data point along x and y axes (4x smaller than original data). c7ch0step221.cmap, c7ch1step221.cmap. They can be viewed with Chimera using menu entry
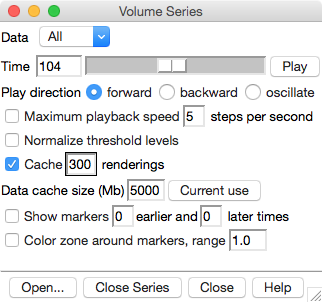
Tools / Volume Data / Volume Series
Press the Open button on the Volume Series dialog to open each of these data sets. At the top of the Volume Series dialog set the Data set to "All" so that the time slider controls both the collagen and cell map time. Press the "Play" button to play through the times.
The large data can take minutes to load. Setting the "Data cache size (Mbyte)" field to 5000 if your computer has at least 8 Gbytes of memory will improve performance. Setting the "Cache [N] renderings" value to 300 will also improve performance by keeping surfaces for all the times in memory, but takes another few Gbytes of memory. The speed-up will only be apparent after you play through the entire data set one time, since data for each time is not loaded until it is first displayed.