Tom Goddard
February 17, 2021, updated January 3, 2022
For UCSF Methods in Macromolecular Structure course.
This tutorial is to get to know some basics of using ChimeraX software (version 1.2 or newer) to look at atomic models of proteins and X-ray density maps and electron microscopy density maps. The commands links can be executed if you open this tutorial in ChimeraX wtih menu entry Help / Tutorials.
There is some material on other pages showing molecular dynamics trajectories and NMR chemical shift perturbations.
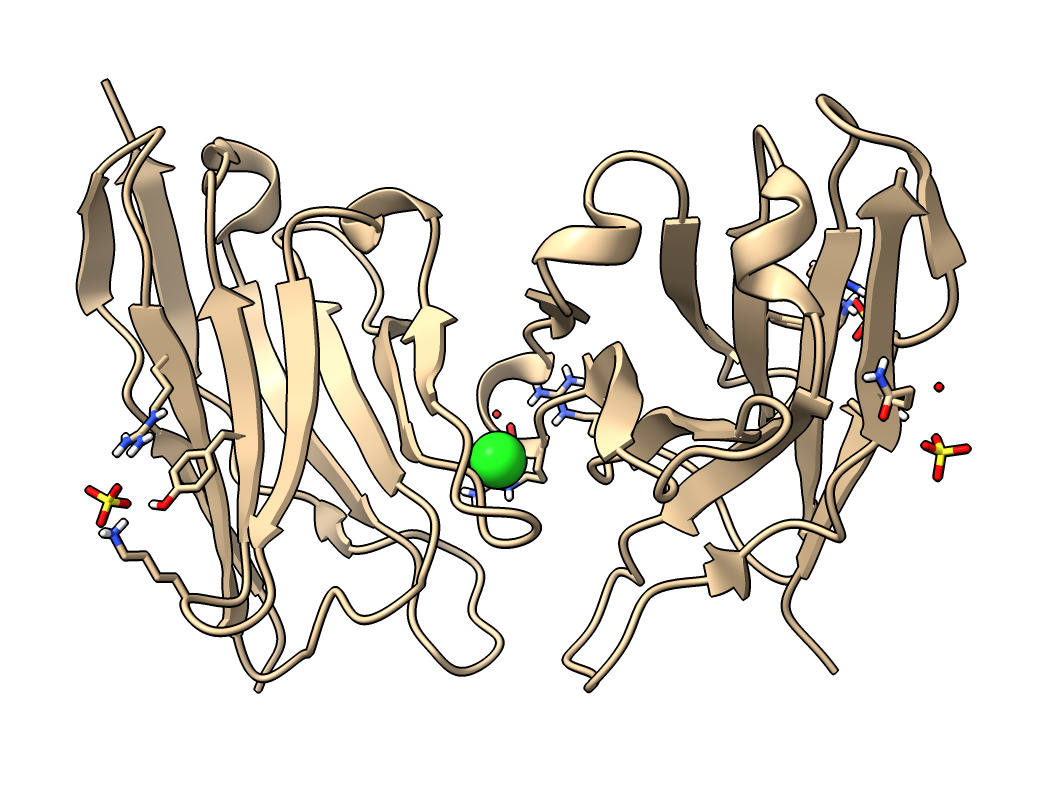
We will look at nanobodies that bind to SARS-CoV-2 spike proteins and neutralize the virus. These nanobodies were used to make a therapeutic aerosol that when sprayed in the nose can block SARS-CoV-2 infection. Aashish Manglik and many others at UCSF created this therapeutic.
    An ultrapotent synthetic nanobody neutralizes SARS-CoV-2 by stabilizing inactive Spike.
    Schoof M, Faust B, Saunders RA, Sangwan S, Rezelj V, Hoppe N, Boone M, Billesbolle CB,
      Puchades C, Azumaya CM, Kratochvil HT, Zimanyi M, Deshpande I, Liang J, Dickinson S,
      Nguyen HC, Chio CM, Merz GE, Thompson MC, Diwanji D, Schaefer K, Anand AA, Dobzinski N,
      Zha BS, Simoneau CR, Leon K, White KM, Chio US, Gupta M, Jin M, Li F, Liu Y, Zhang K,
      Bulkley D, Sun M, Smith AM, Rizo AN, Moss F, Brilot AF, Pourmal S, Trenker R, Pospiech T,
      Gupta S, Barsi-Rhyne B, Belyy V, Barile-Hill AW, Nock S, Liu Y, Krogan NJ, Ralston CY,
      Swaney DL, García-Sastre A, Ott M, Vignuzzi M; QCRG Structural Biology Consortium, Walter P, Manglik A.
    Science. 2020 Dec 18;370(6523):1473-1479. doi: 10.1126/science.abe3255. Epub 2020 Nov 5. PMID: 33154106.
Nanobodies are much smaller type of antibody, a single protein domain, found in camels, llamas, alpaca ("camelids"), and sharks. They are much easier to engineer than full-size antibodies.
| Action | Notes |
|---|---|
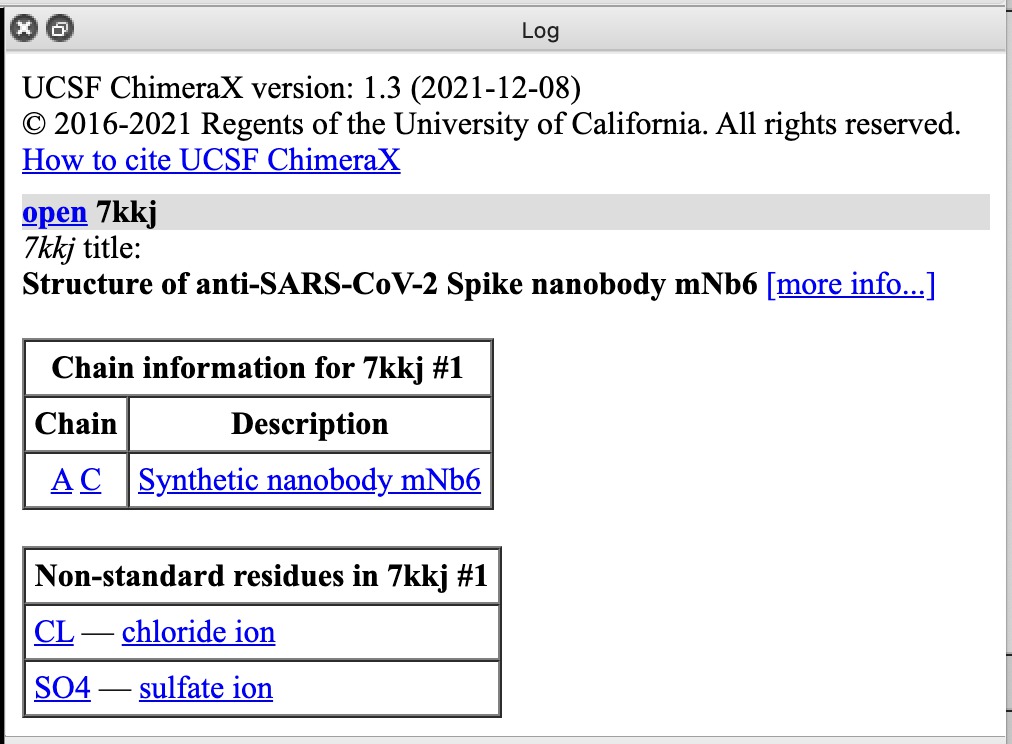
| Type command open 7kkj | Fetches Protein DataBank nanobody structure with PDB id 7kkj. |
| 2-finger trackpad drag to rotate | Works on Mac laptop. Or use left mouse button, or trackpad click and drag. Command turn y 45 |
| 3-finger trackpad drag to translate | Works on Mac laptop. Or use right mouse button, or Alt or Cmd modifier key plus mouse drag. Command move x 15 |
| 4-finger trackpad drag or pinch to zoom | Works on Mac laptop. Or use mouse scroll wheel, or two-finger trackpad scroll on Windows. Command zoom 2 |
| Action | Notes |
|---|---|
| Click chain A or C links in Log panel | This selects each copy of the nanobody, outlining it in green. Command select /A |
| Click CL chloride ion link | Selects ion. To show it click Show Atoms in Toolbar. Toolbar buttons operate on selected atoms. Commands select :CL and show :CL |
| Click SO4 sulfate ion link | Sulfate probably helps crystallization. This structure was solved by X-ray crystallography. Command select :SO4 |
| Click more info... link | Log shows literature citation and X-ray diffraction resolution 2.05 Angstroms. Command log metadata #1 |
| Action | Notes |
|---|---|
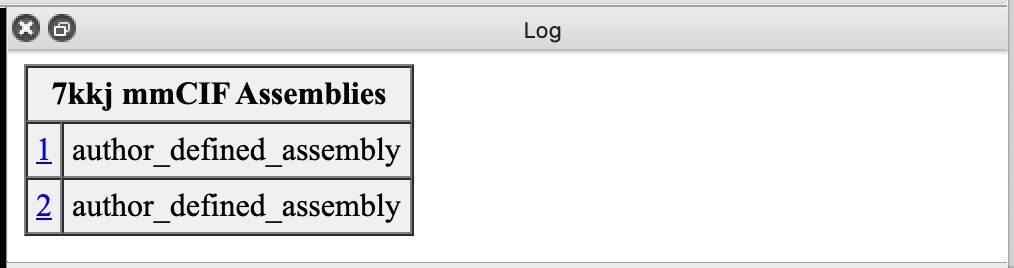
| Click 1 link in mmCIF Assemblies table. | Shows just one copy of nanobody. Sometimes assemblies create large multimers like a virus capsid structures from a single capsid protein. Command sym #1 assembly 1 |
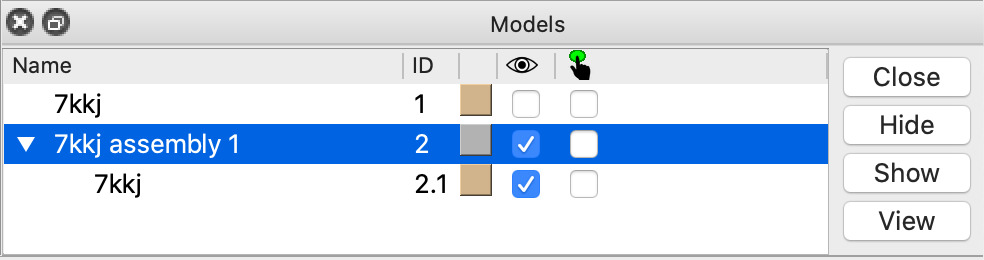
| Click assembly line in Models panel and Close button | Closes the single nanobody copy made in the previous step. Command close #2 |
| Click Models panel checkbutton under the eye icon for model #1 | This checkbutton hides and shows the atomic model. Command show #1 model |
| Action | Notes |
|---|---|
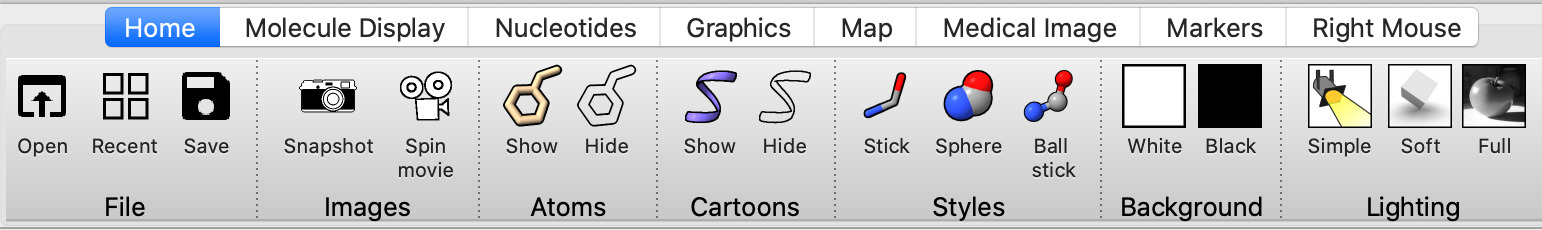
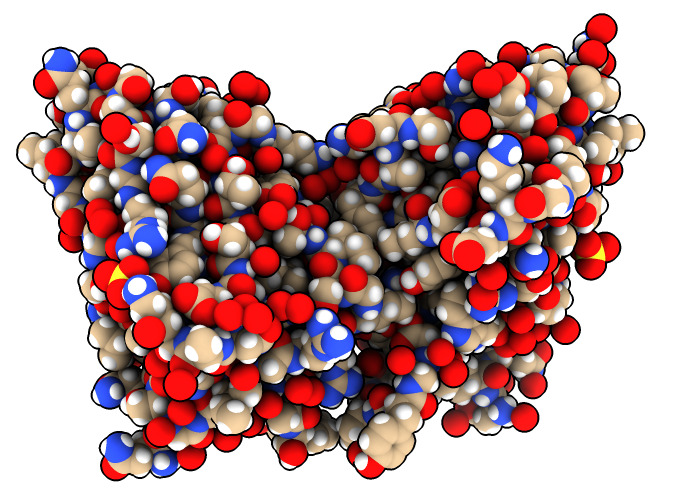
| Click Show Atoms toolbar button. | Notice there are hydrogen atoms (white) -- usually not seen in a 2 Angstrom resolution structure. Command show #1 atoms |
| Hide Cartoon toolbar button. | Command hide #1 cartoon |
| Try Sphere and Ball and Stick styles. | Command style #1 sphere |
| Soft lighting | This casts shadows from 64 directions. With atom spheres it makes crevices dark. Command light soft |
| Full lighting | This is like soft with an added spot light that casts a sharp shadow, Command light full |
Change display style of just one protein.
| Action | Notes |
|---|---|
| Click with ctrl key down one atom. | Ctrl-click select an atom. Shows green outline around atom. Command select /A:43@NZ |
| Press up-arrow keyboard key. | Extends to select whole residue. Command select up |
| Press up-arrow again. | Selects whole beta-strand. Another press selects whole chain. Command select up |
| Hide atoms, show cartoon. | Toolbar buttons only act on selected atoms. Commands hide sel atoms and show sel cartoon |
| Press down-arrow. | Reduces the selection. Command select down |
| Ctrl-click not on an atom. | Clears the selection. Or menu Select / Clear. Command select clear |
Different coloring to highlight different aspects of structure.
| Action | Notes |
|---|---|
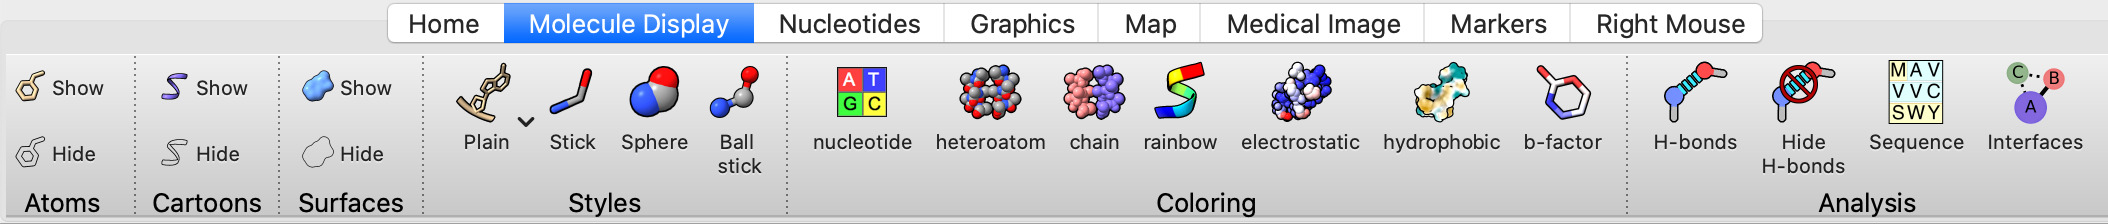
| Click Molecule Display tab of toolbar | The toolbar has many tabs to provide different sets of operations. |
| Color Chain | Useful to see boundaries between proteins. Command color bychain |
| Color Heteroatom | Makes oxygen red, nitrogen blue, leaves carbon colors unchanged. Command color byhetero |
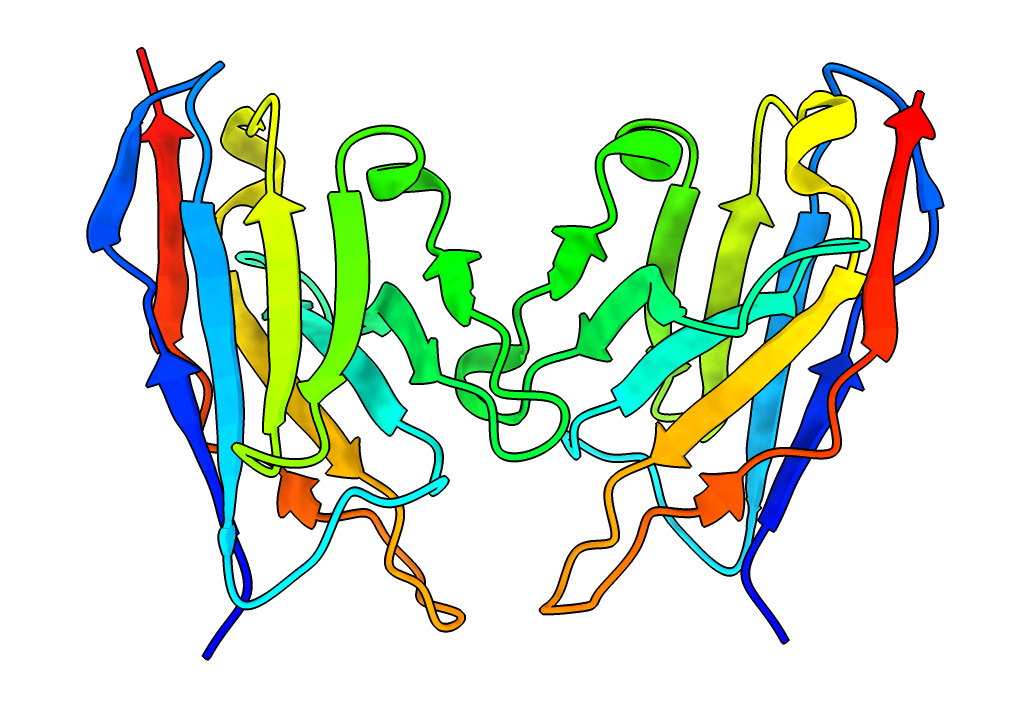
| Color Rainbow | Blue at N-terminus to red at C-terminus, usually used with ribbon display to see path of the backbone. Note 4-strand beta sheets are not a contiguous span of residues. Command rainbow |
| Menu Presets / Original Look | To restore original structure appearance, including color, styles and what atoms shown. Command preset original |
Coloring surfaces by electrostatic potential, hydrophobicity or B-factor.
| Action | Notes |
|---|---|
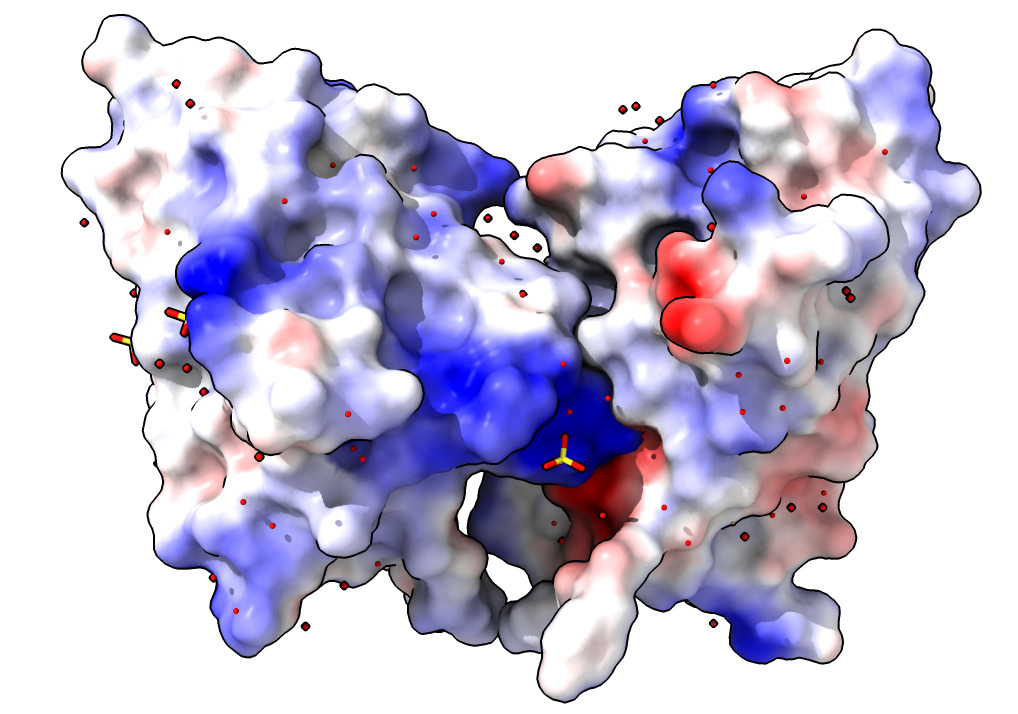
| Click Surface Show icon in Molecule Display toolbar | Surface shown for each chain. Does not enclose water or ligands. Solvent excluded surface defined by rolling water-size sphere over protein. Command show surfaces |
| Click Electrostatic coloring. | Uses calculated charges on atoms. Red is negative, blue is positive. Notice the two bright red/blue interfaces between the two nanobodies -- opposite charges attract. Command coulombic |
| Click Hydrophobic coloring. | Blue is hydrophilic, yellow is hydrophobic. Notice the paired yellow hydrophobic interfaces between the two proteins. Interfaces like to bury hydrophobic regions. Command mlp |
| Click B-factor coloring. | Red indicates mobile atoms in X-ray data -- usually at periphery of structure. Blue indicates immobile regions usually in core. Command color bfactor |
Display sequence of protein.
| Action | Notes |
|---|---|
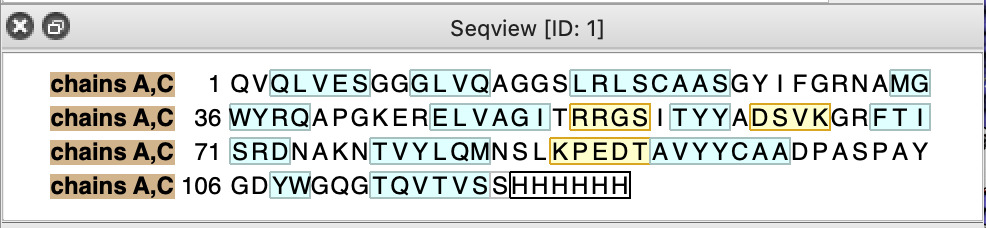
| Click Sequence icon in Molecule Display toolbar | Shows amino acid sequence in separate panel. Beta strands blue, alpha helices yellow. Command sequence chain /A |
| Click and drag on sequence to select | Green outline of selected residues shown on structure. Command select /A:62-65 |
| See six histidines at end of sequence | Black outline box means these residues do not have atom coordinates. Histidine tag for purifying protein. |
| Action | Notes |
|---|---|
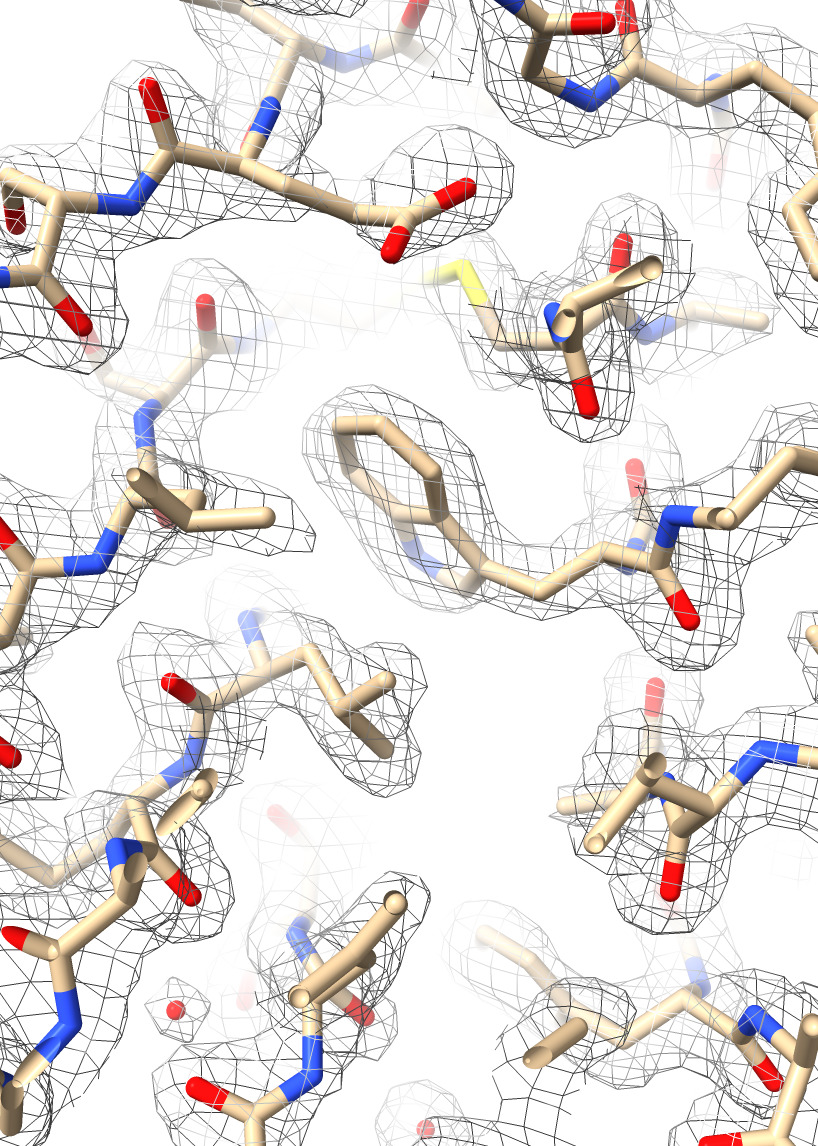
| Type command open 7kkj from eds | Fetches X-ray density from the Electron Density Server 7kkj. |
| Hide cartoons, show atoms with toolbar | Want to see atoms to compare to X-ray density. Commands hide cartoon and show atoms |
| Ctrl-click Volume Viewer histogram, menu Show Outline Box | This shows the unit cell of the x-ray map, a skewed box. Command volume #2 showOutlineBox true |
| Click Zone icon in Map toolbar | Show only the density mesh near the atomic model. Command volume zone #2 nearAtoms #1 range 3.7 |
| Typed command hide H | Hide hydrogen atoms to reduce visual clutter. They are not visible in density. |
| Menu Tools / General / Side View | Shows view of molecule from side with eye and clip planes (vertical lines). Command ui tool show "Side View" |
| Drag vertical bars in Side View to clip | Sets near/far clipping to look at a thin slab. Command clip near -5 far 5 |
| Drag vertical bar on Volume Viewer histogram | This changes the density level for showing the mesh surface to see weaker or stonger signals. Command volume #2 level 0.5 |
| Click Clip in Right Mouse toolbar | Enables moving clip planes in graphics window with right mouse button, or Command key + trackpad on Mac. Command ui mousemode right clip |
| Command+Shift key drag | Moves near and far planes together to see different depths in density. Command clip near 1 far 1 |
| Action | Notes |
|---|---|
| Close previous models with Model Panel Close button. | Command close |
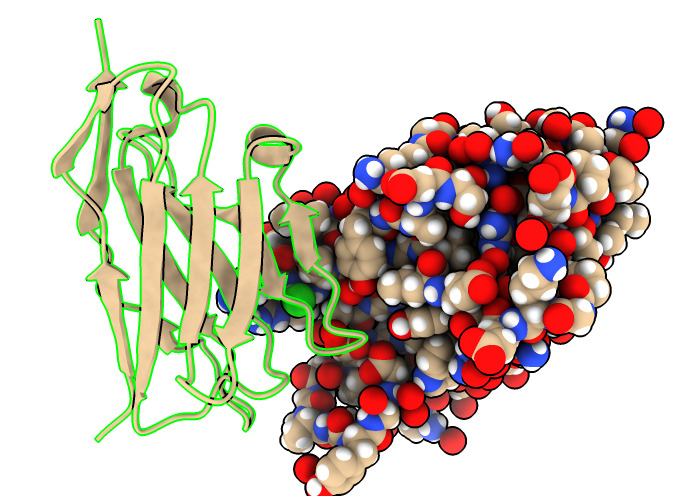
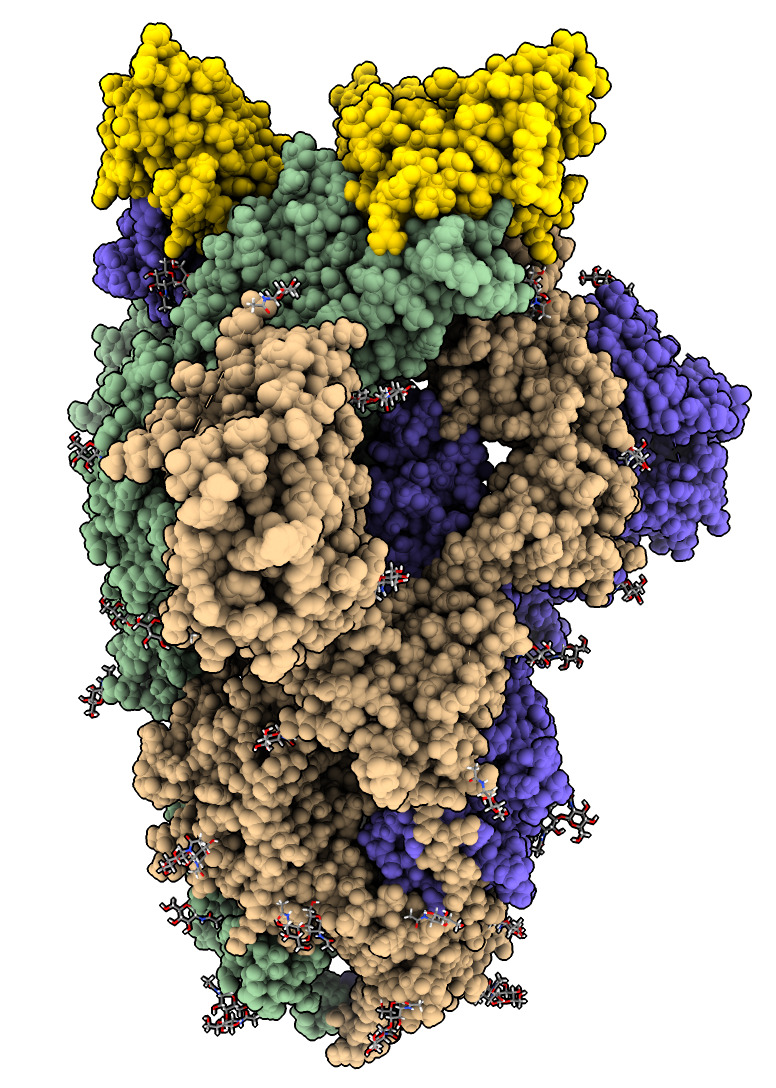
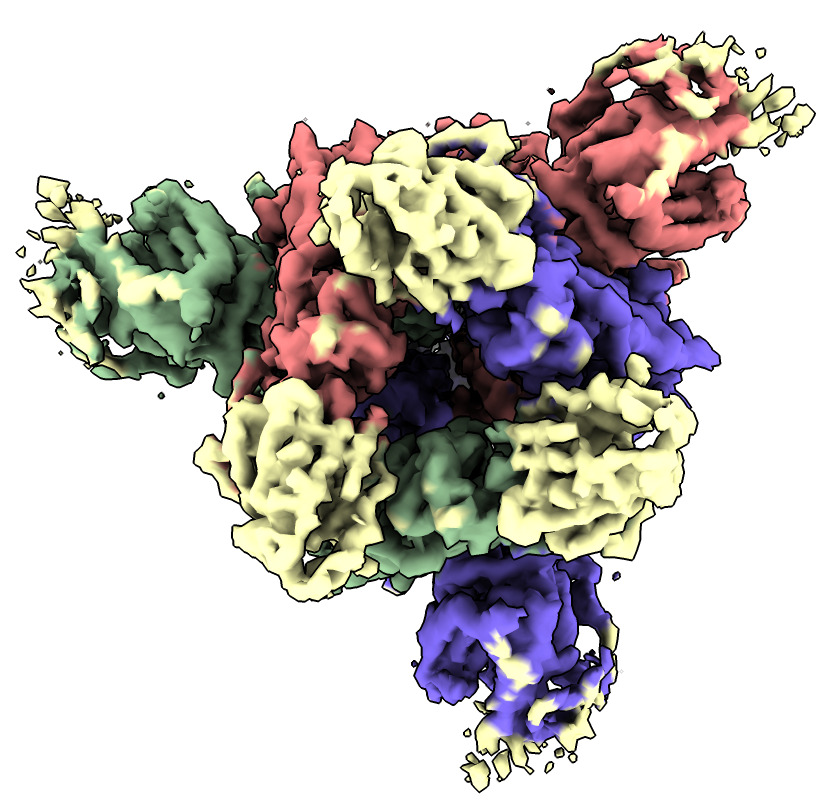
| Type command open 7kkl | Open Protein DataBank SARS-CoV-2 spike with bound nanobody, PDB id 7kkl. |
| Hover mouse over nanobodies to find chain identifiers. | Chains B, E and F are 3 bound nanobodies shown in popup window when hovering mouse. |
| Type command color /B,E,F gold | Color nanobodies gold. |
To make an image for a presentation often use white background, lighting, silhouettes.
| Action | Notes |
|---|---|
| White background from Home toolbar | White background is usually better than black in articles and talk slides. Command set bgColor white |
| Silhouettes from Graphics toolbar | Puts thin black lines around edges of structure, helps see overlaps. Command graphics silhouettes true |
| Soft lighting from Graphics toolbar | Shadows show depth in a static image. Command light soft |
| Snapshot from Home toolbar | Saves an image file to the Desktop matching the size shown on the screen. Command save image1.png |
| save spike.png width 1000 transparent true typed command | Saves a higher resolution image. When overlaying on top of another image use transparent background. |
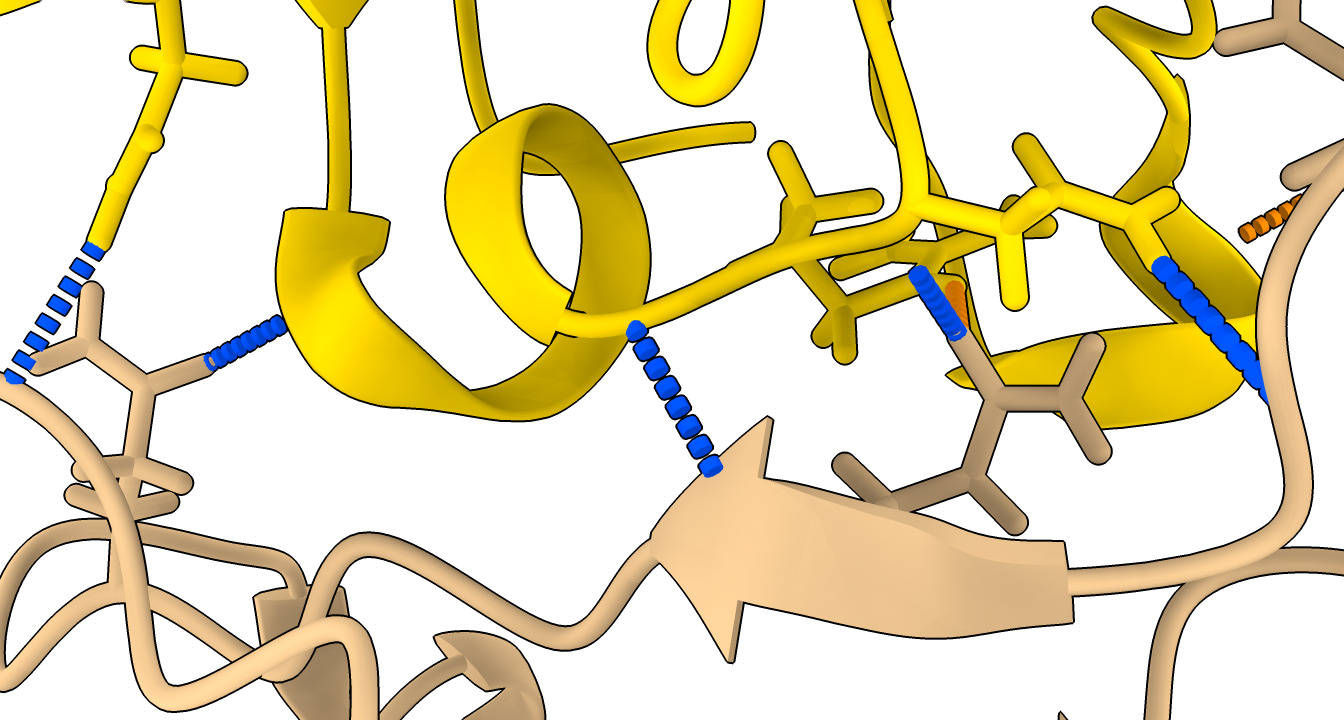
Look at hydrogen bonds between nanobody and spike.
| Action | Notes |
|---|---|
| Click H-bonds in Molecule Display toolbar | Shows predicted hydrogen bonds in structures. Command hbonds reveal true |
| Select nanobody and click H-bonds | Show only hydrogen bonds with nanobody. Commands select /F and hbonds sel |
| Hide atoms and cartoons with toolbar | Command hide atoms,cartoon |
| Typed command show /D,F cartoon | Visually simplify by only showing one nanobody, one spike protein. |
| Tools / Structure Analysis / H-Bonds menu | More options for showing hydrogen bonds. Command ui tool show H-Bonds |
| Hydrogen bonds panel options: Limit selection with exactly one end selected | Show hyrdogen bonds only between nanobody and spike. Command hbonds sel restrict cross reveal true |
| Press Ok or Apply button in H-bonds panel. | 9 hydrogen bonds found, table shown in Log panel. 6 are to spike chain D and 3 to undisplayed chain A. |
9 H-bonds
H-bonds (donor, acceptor, hydrogen, D..A dist, D-H..A dist):
/A ASN 440 ND2  /F GLN 39 OE1   /A ASN 440 HD22  3.004  2.048
/D TYR 489 OH   /F ASP 99 O     /D TYR 489 HH    2.868  1.876
/D SER 494 N    /F GLY 30 O     /D SER 494 H     2.936  1.929
/F GLY 26 N     /D GLN 498 OE1  /F GLY 26 H      2.865  1.851
/F ARG 31 NE    /D GLN 493 OE1  /F ARG 31 HE     3.071  2.213
/F ASN 32 N     /D GLN 493 OE1  /F ASN 32 H      2.907  1.902
/F ASN 32 ND2   /D PHE 490 O    /F ASN 32 HD22   2.939  1.936
/F ASN 77 ND2   /D GLY 446 O    /F ASN 77 HD21   3.084  2.067
/F GLN 111 NE2  /A PRO 499 O    /F GLN 111 HE21  2.854  1.838
Spike structure with bound nanobody came from electron microscopy, EMD 22910 as shown on the PDB web page for 7kkl.
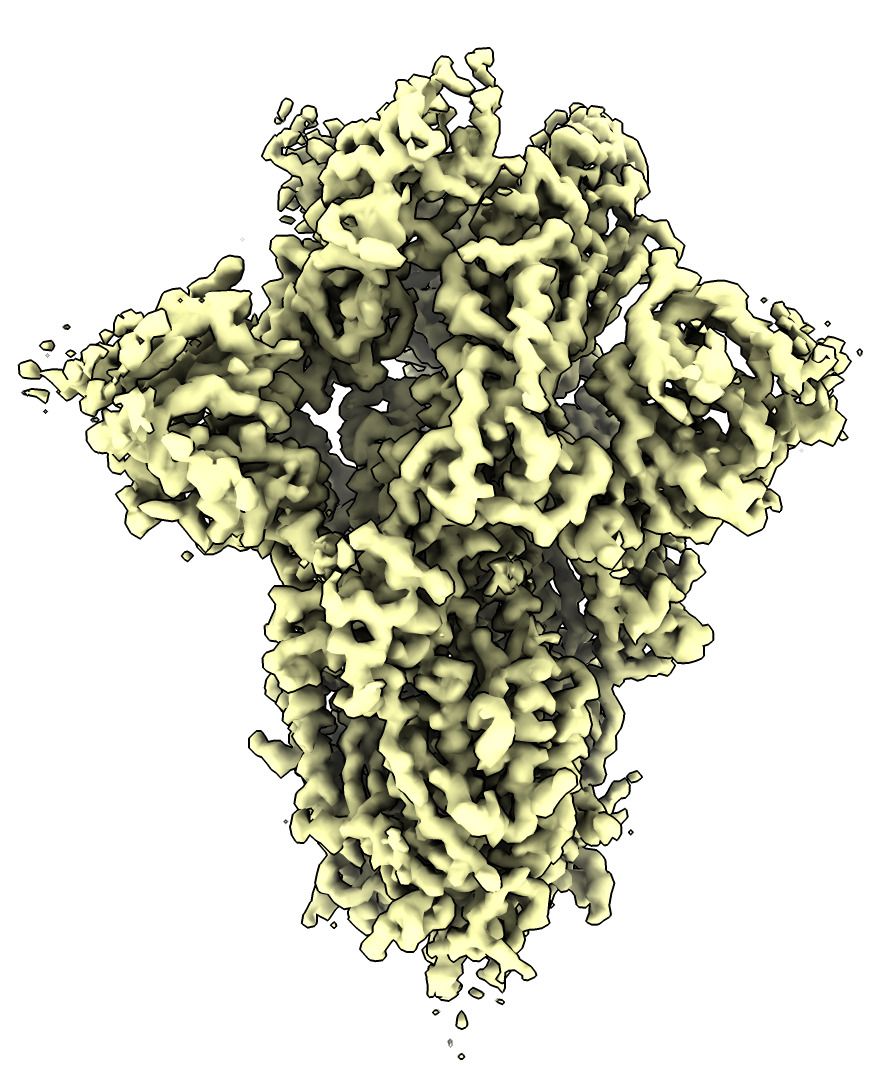
Here is a smaller EM map file emd_22910_trimmed.mrc (7 Mbytes, smaller box, subsample step 2) while the database map is 226 Mbytes and can be slow to download.
| Action | Notes |
|---|---|
| Open downloaded map emd_22910_trimmed.mrc
or Type command open 22910 from emdb | You can double click the file icon, or use the Open toolbar button or File / Open... menu entry to open the downloaded reduced size map file.
or With fast network (> 100 Mbits/sec) just fetch the 226 Mbyte file directly from the EM Databank. |
To start building an atomic model from electron microscopy we fit in previously know atomic structures.
| Action | Notes |
|---|---|
| Close atomic model using Model Panel | Command close #1 |
| Type command open 6vxx | Open Protein DataBank SARS-CoV-2 spike, PDB id 6vxx. |
| Click color chain in molecule toolbar | The spike is a trimer, each protein copy a separate color. Command color bychain |
| Click Move model in Right Mouse toolbar | We will move the trimer by hand into the correct position in the EM map. Command ui mousemode right "translate selected models" |
| Ctrl-click ribbon to select a residue | The selected model will be moved while the map stays still. Command select /A:953 |
| Drag to move spike into map. | Hold Command-key on Mac with trackpad, or use right mouse button, or Alt-key on Windows. Command move x -50 model #1 |
| Shift-key + drag to rotate spike. | Pressing or releasing the shift key switches between translating and rotating the model. Command turn z 180 model #1 |
Do a local rigid motion to optimize the manually fit position.
| Action | Notes |
|---|---|
| Click Fit icon in Map toolbar | Do local rigid fit optimization moving spike atomic model, takes less than a second. Command fitmap #1 inMap #2 |
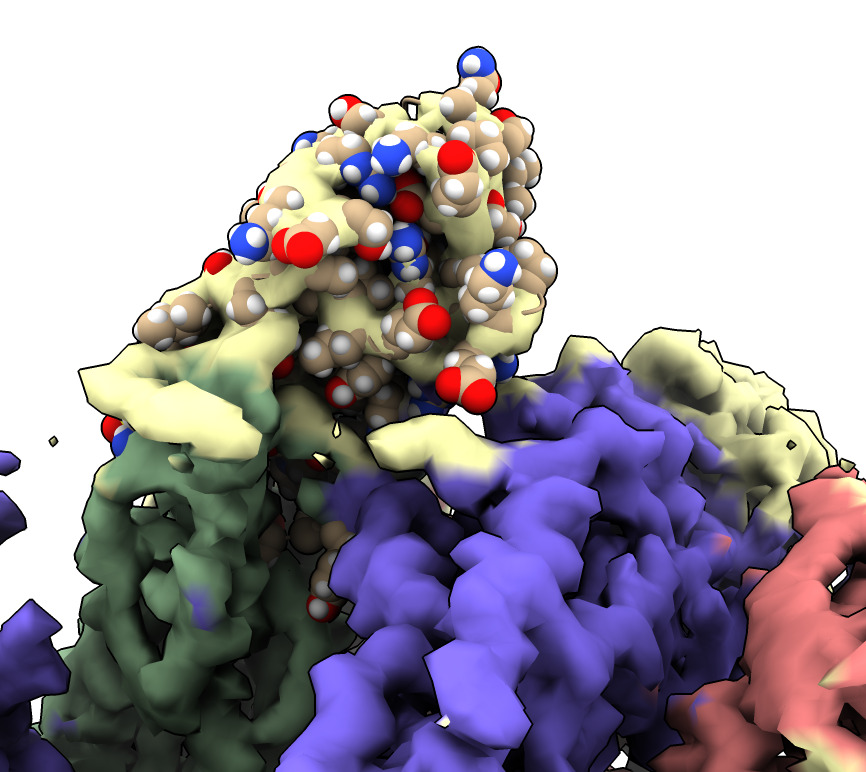
| Show atoms as spheres | Molecule display toolbar, unselect (ctrl-click background), Show atoms, Sphere style. Commands select clear and show atoms and style sphere |
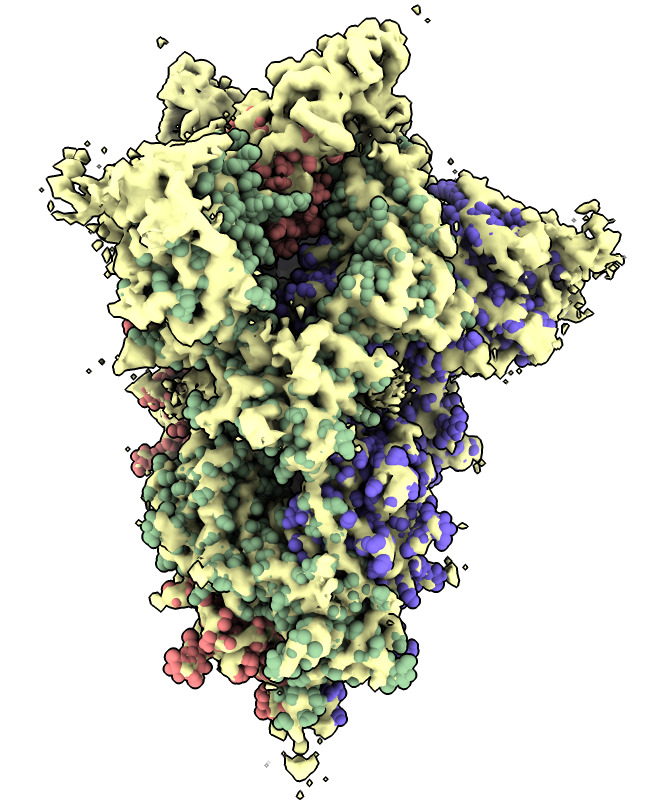
Color the map near the fit spike atomic model. The place not colored is where the nanobody binds.
| Action | Notes |
|---|---|
| Click Color near atoms icon in Map toolbar | Color map to match atomic model colors. Command color zone #2 near #1 distance 5 |
Same procedure as fitting spike. Place manually, optimize fit. Need to place 3 copies of nanobody. Getting the right orientation is very challenging.
| Action | Notes |
|---|---|
| Type command open 7kkj | Open Protein DataBank nanobody structure with PDB id 7kkj. |
| Typed command delete #3/C | First delete one of the two nanobody copies in X-ray model. |
| Typed command delete solvent | Water molecules in nanobody are distracting. Delete them. |
| Use Move model in Right Mouse toolbar | Move the nanobody by hand into the correct position in the EM map. Command ui mousemode right "translate selected models" |
| Ctrl-click an atom to select nanobody and drag nanobody into map | Hold Command-key on Mac with trackpad, or use right mouse button, or Alt-key on Windows. Pressing or releasing the shift key switches between translating and rotating the model. |
| Type command fit #3 in #2 | Command to rigidly optimize fit of nanobody in map. |
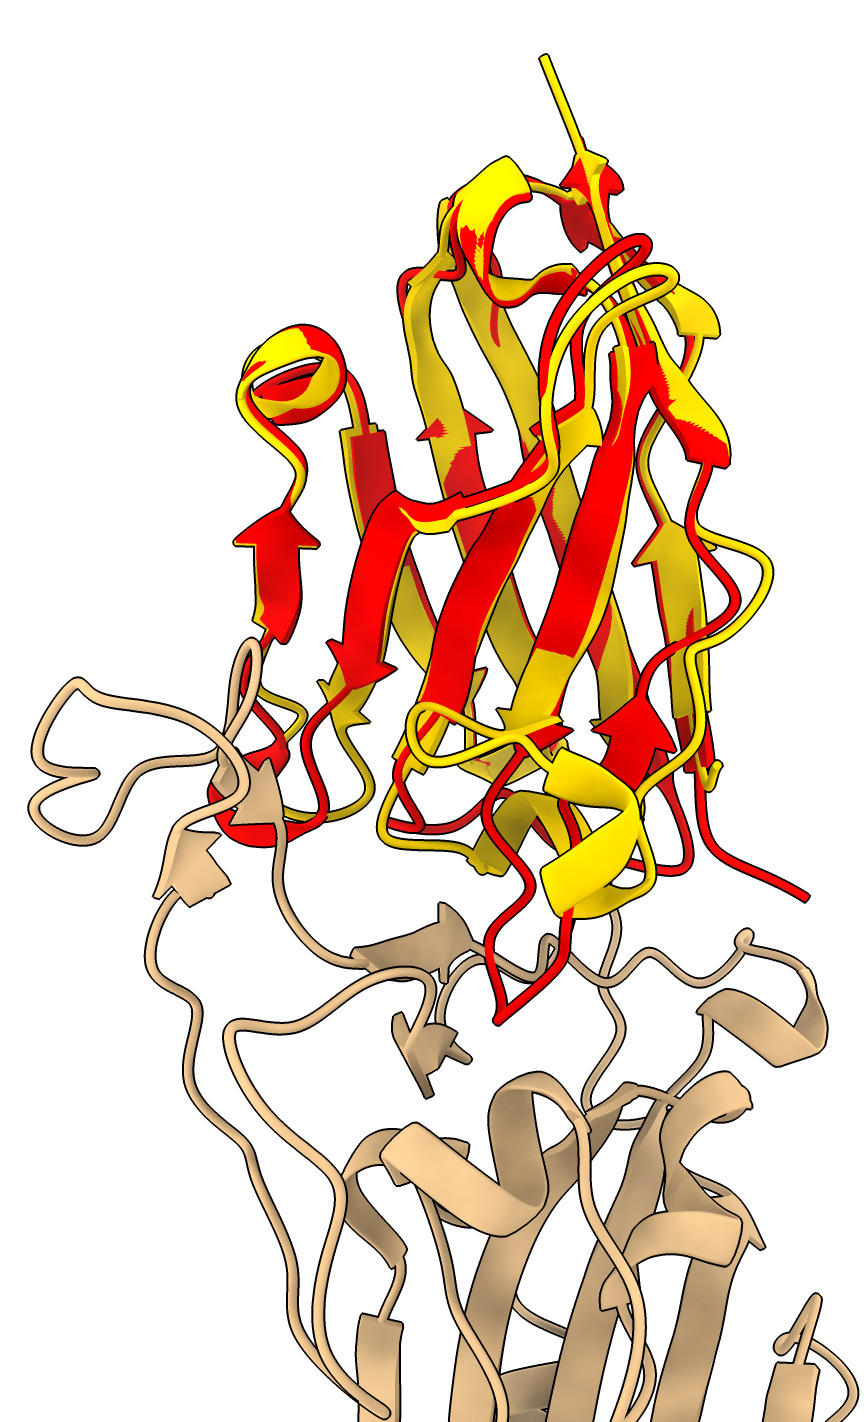
The nanobody bound to the spike adopts a different conformation than the unbound x-ray nanobody atomic model. Superimpose them.
The loops that interact with the spike move a great deal.
| Action | Notes |
|---|---|
| Show x-ray nanobody and 7KKL spike/nanobody models | Commands close and open 7kkj 7kkl |
| Show in cartoon style | Use Molecule Display toolbar, Hide Atoms, Show Cartoon. Commands hide atoms and show cartoon |
| Type command color #1 red | Make x-ray nanobody a contrasting color. |
| Type command color #2/F gold | Make EM nanobody a contrasting color. |
| Menu Tools / Structure Analysis / Matchmaker | This panel will align the two nanobodies. Rigid motion to minimize corresponding C-alpha atom positions. |
| Click Specific chains ... with specific chains. | To specify exactly which chains to align. |
| Click 7kkl #2/F as Reference chain | This is the target we align to. |
| Choose 7kkj #1/A as Chain to match | This is the x-ray nanobody model. |
| Click Ok in Matchmaker panel | Does the alignment. |
| Command matchmaker #1/A to #2/F | This command does the same thing as all those previous steps with the Matchmaker panel. |
| Type command hide #1/C #2/A,B,C,E cartoon | Hide extra chains of spike and nanobody model to get clearer view. |
Next steps would be to use the ISOLDE flexible atomic model refinement package using manual tugging and molecular dynamics to make the spike and nanobody agree with the EM density.