Utility Plugins
Description
These plugins provide some relatively discrete functionality that can be useful. Some of thse are relatively constrained (e.g. EdgeLister) and some provide more significant functionality such as the Dynamic Expression Plugin.
Add Parent Neighbors Plugin
This simple plugin allows you to extend a child network by adding the neighbors of a selected node in the parent network. This can be useful when you have a large, complex network and you want to focus in on some portion of it. For example, if you create a child network of p53 interaction partners from a larger network of all Human protein-protein interactions. If you find an interesting interaction partner to p53, and want to see its interaction partners, you can select the partner in the child network and select Plugins→Add neighbors from parent to add all of the interaction partners of that node in the parent network to this network.
Batch Tool Plugin
batchTool has been replaced by the much more functional commandTool plugin, which supports all of the functionality of batchTool as well as the ability to include commands registered by plugins
Command Tool Plugin
The commandTool plugin provides a simple command-line interface to Cytoscape using the CyCommands API. Any plugin that registers commands will be available through commandTool. commandTool provides two main functions: first, it can pop-up a Command Line Dialog that allows the user to type commands into Cytoscape and see the results in a "Reply Log". Second, and arguably more useful, it will read script files and execute them. Each line in the script file is a command that is sent to a plugin. Script files may be entered on the Cytoscape command line using the "-S" flag to Cytoscape, or through the "Run script..." menu item under Plugins→Command Tool. commandTool uses the CyCommand API to provide help. "help" by itself will list all of the command classes (or namespaces) and "help " followed by a namespace will list all of the commands supported by that namespace. Details of a specific command are available by typing "help " followed by the namespace and command (e.g. "help layout force-directed"). commandTool registers the "commandtool" namespace and supports a single command: run, which takes a file argument. Here is the help for the commandtool run command from commandtool:
help commandtool run
  commandtool run: Run a command script from a file
    Arguments:
      [file=value]
Edge Length Plugin
The Edge Length Plugin is a simple plugin that was written to support the paper "Network Validation...". The plugin adds a new attribute, length to each edge. This attribute is the actual length of the edge measured as the Euclidean distance between the source node and the target node. This can be used to determine the accuracy of edge weighted layout algorithms and estimate the "edge frustration" as it was called in the paper, where edge frustration is defined as the actual layout and a perfect layout. A perfect layout is defined as one in which all of the edge lengths are proportional to their weights, which is only possible in the general case in n dimensions, where n is the number of nodes - 1. To add the new edge attribute, the plugin adds a new menu: Plugins→Calculate Edge Lengths. This is not a dynamic attribute, so the plugin will need to be called after each layout change.
Edge Lister Plugin
The Edge Lister Plugin is a simple plugin that provides the functionality to name a set of edges for later action. The plugin registers the Edge Memory submenu under the Plugins menu. The Edge Memory has five submenus, which are discussed below.
- Remember selected edges...
- Initially, all of the submenu items will be greyed out (unselectable) except for this one. Once a group of edges have been selected, that selection may be named (remembered) by selecting this menu item. A dialog will appear (see Figure 1) to allow the user to name the selection. Once there is a named selection, the other menu items will be selectable and can be used to operate on any named selection.
- Hide edges→
- Underneath this menu will be a submenu for each named selection. Choosing a named selection will cause that group of edges to be hidden (removed from the network), even if they are not currently selected.
- Remove list→
- Removes the named selection from the list of named selections. If there are any edges hidden, they will be restored before the named selection is removed.
- Restore edges→
- If the edges for this named selection are hidden, they will be restored.
- Select edges→
- Select the edges associated with this named selection.
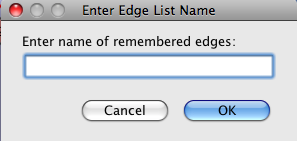
Figure 1. The Enter Edge List Name dialog is shown to allow users to name the selected group of edges.
Node Chart Plugin

Figure 2. The sample network galFiltered with nodes painted with a pie graph representing the significance of the expression difference for each experimental condition as expressed in the attributes "gal1RGsig (red), gal4RGsig (yellow), and gal80Rsig (green)". This was created with the command: nodecharts pie nodelist="all" attributelist="gal1RGsig,gal4RGsig,gal80Rsig" colorlist="contrasting"
The Node chart plugin exports commands that can be used by users (via the Command Tool) or by plugin developers who can call the commands using the Cytoscape CyCommandHandler mechanism. In either case, node charts provides a simple way to paint bar, line, or pie graphs onto nodes. These graphics are preserved as part of the session, and are rendered as objects, providing excellent graphics stability. The capabilities of the renderings are limited, so users with more complex charting needs should look at the GoogleCharts plugin, which links to the Cytoscape 2.8 formula capability.
Here are the list of commands supported by the nodeCharts plugin:
- nodecharts bar
- Paints a bar chart onto the node, according to the arguments provided. The
valuelist and either node or nodelist arguments are required.
Arguments:- attributelist
- If the values are going to be specified by node attributes, this list provides the attribute or attributes to be used as a comma-separated list.
- colorlist
- The list of colors, one for each bar. colorlist also supports the following keywords:
- contrastingSelect colors base on a contrasting color scheme
- modulatedSelect colors base on a modulated rainbow color scheme
- rainbowSelect colors base on the rainbow color scheme
- randomSelect colors randomly
- up:colorUse color if the value is positive
- down:colorUse color if the value is negative
- labellist
- This list provides the labels to be associated with each bar, point, or pie slice on the resulting graph. The values should contain a comma-separated list of labels, one for each value.
- network
- The network that this command refers to. Note that this is optional -- if it's not provided the current network is used.
- node
- The specific node that this command refers to
- nodelist
- The list of nodes that this command refers to. To have the command take effect for all of the currently selected nodes, the keyword selected is provided. To have it take effect for all nodes, use the all keyword
- position
- The position of the graphic relative to the center of the node. This can be expressed as either an "x,y" pair, or using the main compas points: north, northeast, east, southeast, south, southwest, west, northwest or center.
- separation
- The separation between any two bars
- valuelist
- The list of values (as a comma-separated list) for each point, bar, or pie slice.
- nodecharts clear
- Clears the node chart graphic from a node or list of nodes.
Arguments (hyperlinked arguments are the same as described above): - nodecharts line
- This chart type displays the values passed as arguments as a line chart on the node.
Arguments (hyperlinked arguments are the same as described above): - nodecharts list
- This is a simple command that returns a list of the available chart types
- nodecharts pie
- This chart type displays the values passed as arguments as a pie chart on the node.
Arguments (hyperlinked arguments are the same as described above): - nodecharts stripe
- This chart type displays the values passed as arguments as a series of stripes on the node.
Arguments (hyperlinked arguments are the same as described above):
Laboratory Overview | Research | Outreach & Training | Available Resources | Visitors Center | Search